§ THE LAYER DATA GRID IS LIKE AN EXCEL SPREADSHEET WHERE YOU CAN FILTER YOUR DATA TO ONLY DISPLAY
CERTAIN ROWS OF DATA ON YOUR MAP.
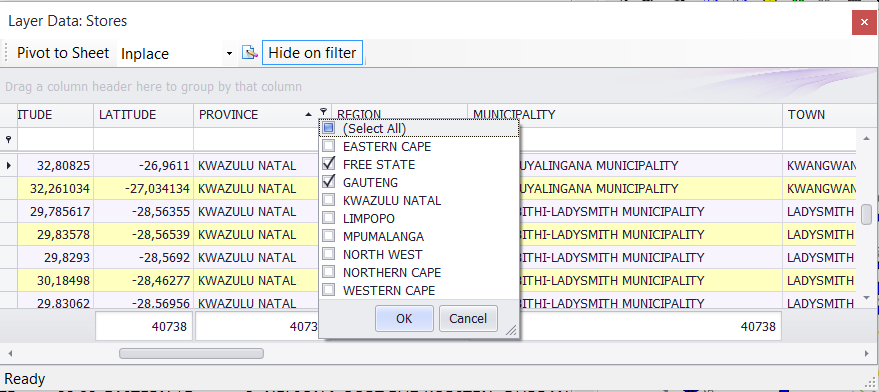
1. Choose the column you want to filter and left click the filter drop down. (The filter drop down is a pin in the top right hand
corner of the column name.)
2. Tick the data you want to view on the map. (You can tick on more than one at a time.)
3. Click OK.
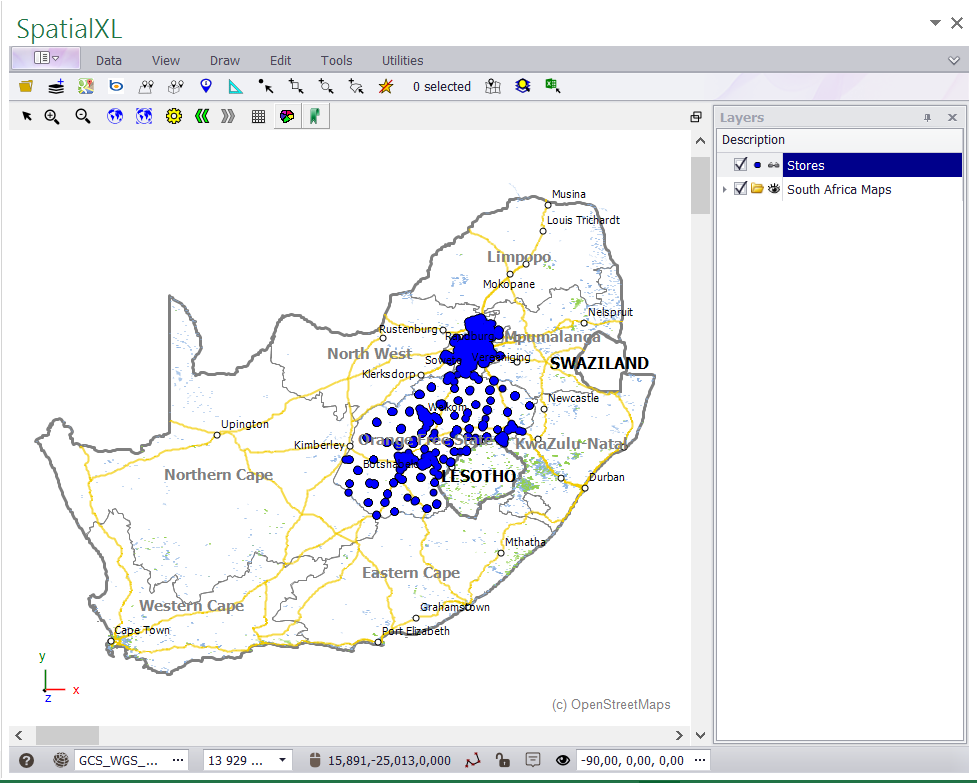
4. Your map will update to only display the filtered data.
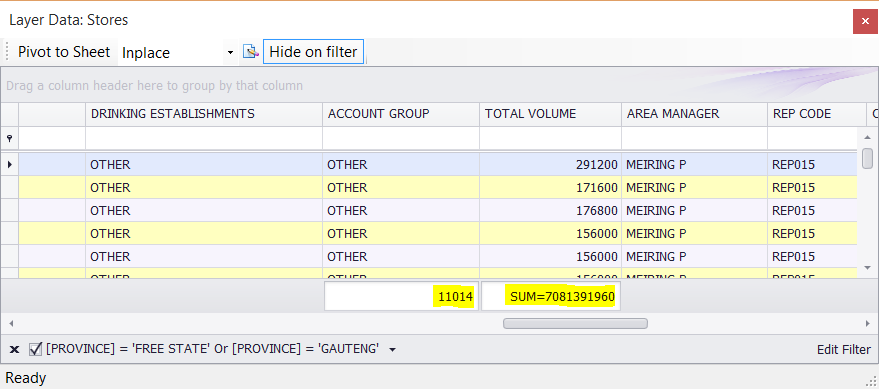
5. As you filter the total COUNT/SUM etc that you have added to the bottom of any of your columns will update to display the
total values for each filter you run.
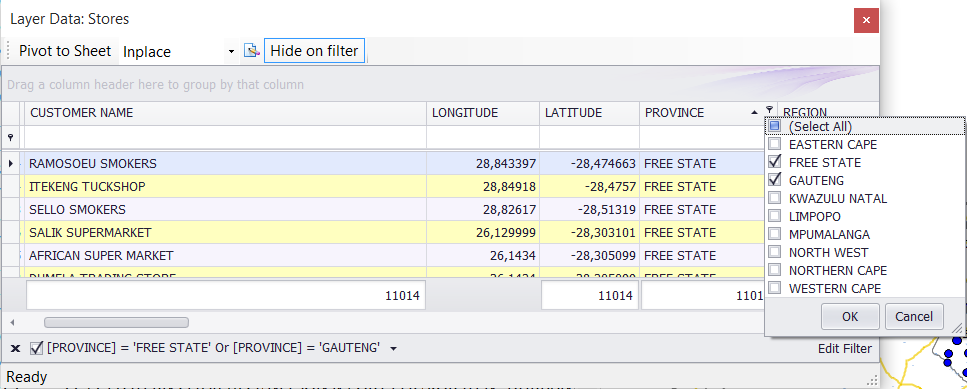
6. To clear the filter and show all your features, you can click the filter drop down and tick SELECT ALL or click the cross at the
bottom left corner of the screen.
7. You can run filters across multiple columns. Your map will update each time a new filter is added.
8. You can also filter by typing into the auto filter line. As you type the value you want to filter your maps will automatically
update.
|
Copyright (c) PrimeThought Software Solutions CC


