Each map layer has a data grid that you can access to select, filter, group or find features on your map
1.12.1 How to open a layer grid
Before opening a layer grid, always make sure your layer is ticked on in the layers description box (1) The eye must be open (2) which means that the layer is visible on the map.

•To open a layer data grid, right click your layer and click ‘View Data’ (1)

•Your layer data grid will appear with columns and rows of data for each feature in your map layer

1.12.2 How to get a total Count, Sum etc. for a column
You can get a total count, sum, min, max, average, or percentage for columns in your Layer Grid
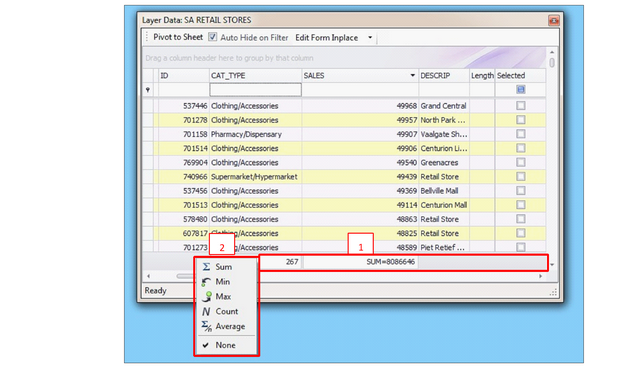
•Right click the dark grey area at the very bottom of a column (1)
•Choose a function from the list (2). Note, you can choose different functions for different columns.
•E.g. In my example I got a count of the total number of rows, and a sum of the total sales volume in my grid.
•Note, the Sum and Average functions will only work for numeric data and will be greyed out for text data
1.12.3 How to Filter in your Layer Data Grid
The Layer Data Grid works like an excel spreadsheet, you can filter your data to only display certain rows of data on your map
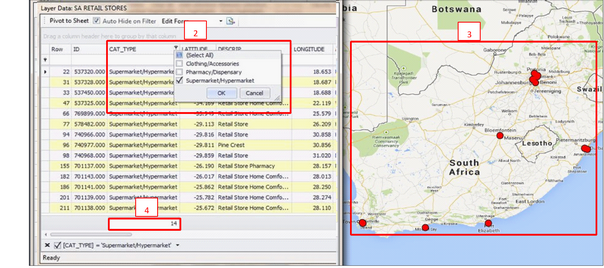
•Choose the column you want to filter, and left click the filter drop down. The filter drop down is a pin in the top right hand corner of the column name(1) .

•Tick the data you want to view on the map. E.g. in my example I chose Supermarkets from the Cat_Type Column (2). Note, you can tick on more than one at a time
•Click Ok
•Your map will update to only display the filtered data E.g. My map is now only displaying Supermarkets (3)
•As you filter the total count/sum etc. that you have added to the bottom of any of your columns will update to display the total values for each filter you run (4)
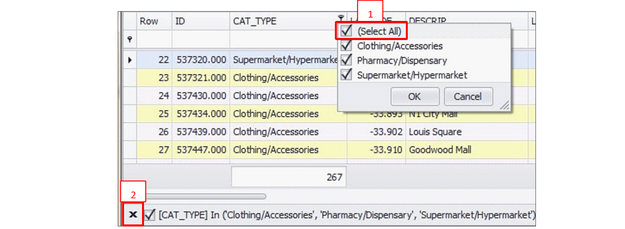
•To CLEAR the filter and show all your features you can
1.Click the filter drop down and tick ‘Select All’ (1) OR
2.Click the Cross at the bottom left corner of the screen (2)
•You can run filters across multiple columns. Your map will update each time a new filter is added
•You can also filter by typing into the Auto Filter Line (1) As you type the value you want to filter, your maps will automatically update

1.12.4 How to sort your data in Ascending/Descending order
You can sort any column in Ascending or Descending order in your Layer Data Grid
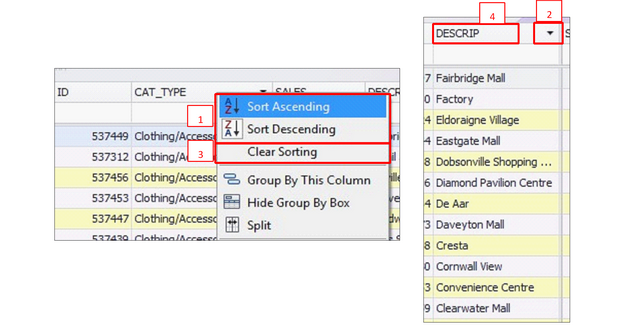
•Right click the column you want to sort and choose either ‘Sort Ascending’ or ‘Sort Descending’ (1)
•Your column will sort accordingly
•An arrow will appear in the right hand corner, indicating whether it is ascending (up) or descending (down) (2)
•To clear the sort right click the column and click ‘Clear Sorting’ (2)
•You can also sort columns by simply clicking the column heading once to sort ascending, and a second time to sort descending (4)
1.12.5 How to highlight/zoom to features on your map
You can select any row (s) in your Layer Data Grid, and highlight/zoom to these on your Map
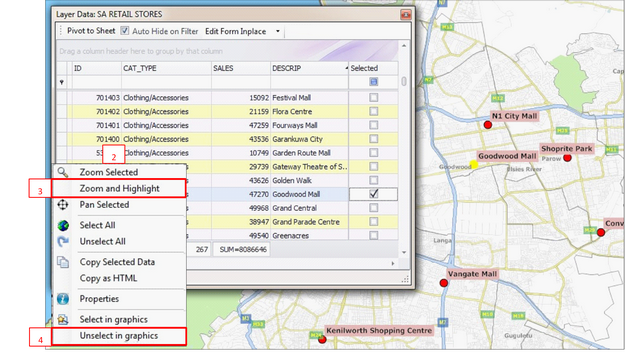
•First select the row(s) you want to highlight/zoom to on the map by left clicking on any cell in that row (1).
•Hint if you want to select more than one row, hold down the control or shift key while you select the other rows
•Once you have selected your row(s) right click your row (or one of the rows) you have selected
•This brings up a list of options (2)
•To zoom to and highlight the rows(s) you have selected in the grid click ‘Zoom and Highlight’(3)
•To remove the selection from the map click ‘Unselect in Graphics’ (4)

1.12.6 How to search/find data in your Layer Data Grid
You can search your Layer Data Grid using the Find Panel
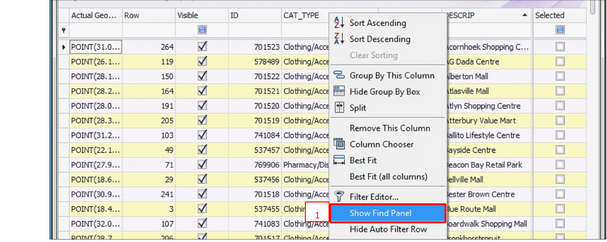
To display the Find Panel right click any column name in your grid and click ‘Show Find Panel’ (1)
•Type in the name of the row you want locate E.g. In my example below I searched for ‘Fairbridge’.
•The grid will filter on any rows containing the word Fairbridge. Your map will also update to display the results of your search only
•Click ‘Clear’ to remove the filter from your grid

To hide the Find Panel when you have finished searching, right click any column name in your grid and click ‘Hide Find Panel’

1.12.7 How to Group (Pivot) your data by column(s)
You can use the Layer Data Grid to group or pivot your data by one or more column
•Choose the first column you want to group. E.g. In my example I have chosen the Province Column
•Right click the column name and click ‘Group By this Column’ (1)
•*Or you can just drag and drop the column name into the group box (2)
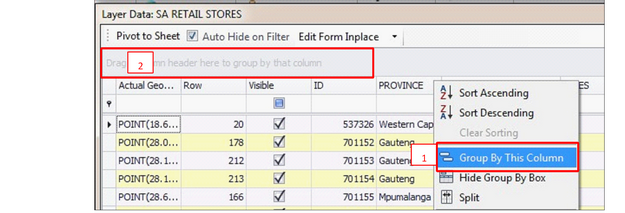
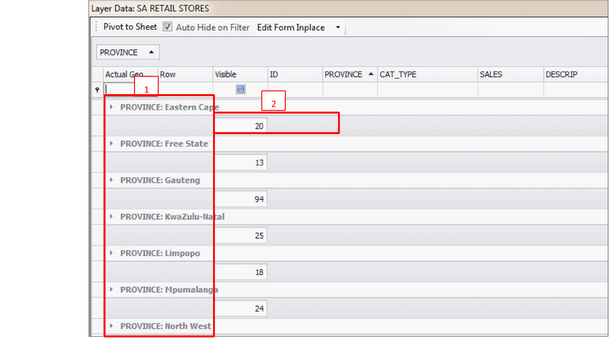
•Your data will now be grouped by the column you selected e.g. Province (1)
•To get a count or sum of data for any of your columns, right click the dark grey row below any of your group layers and choose to get a count or sum etc. for that column (2)
•E.g. In my example I chose to get a count of the total number of rows in each province
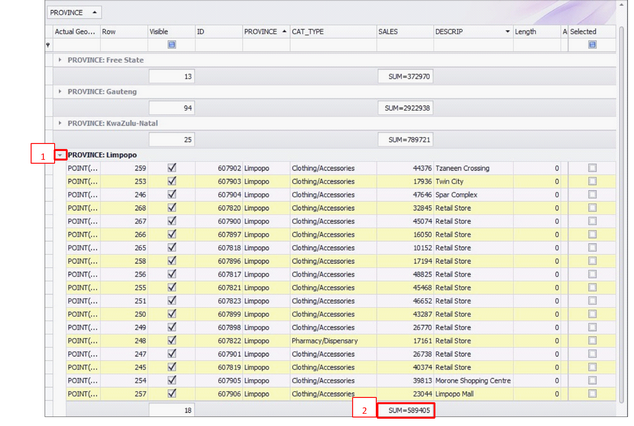
•You can expand any of your group layers to display the rows that make up a group
•Click the drop down arrow next to the group name to expand the group ![]() (1)
(1)
•E.g. in my example I expanded the Limpopo group to see all the rows
•To get a count or sum of data for any of the columns in your groups, right click the dark grey row below any of your layers and choose to get a count or sum etc. for that column (2)
•E.g. in my example I chose to get a sum of sales volumes for Limpopo
| To expand all the groups at once, right click the group box (1) and click ‘full expand’ (2) |
| To collapse all your groups again, click ‘full collapse’ (3) |

You can group your Layer data Grid by more than one column
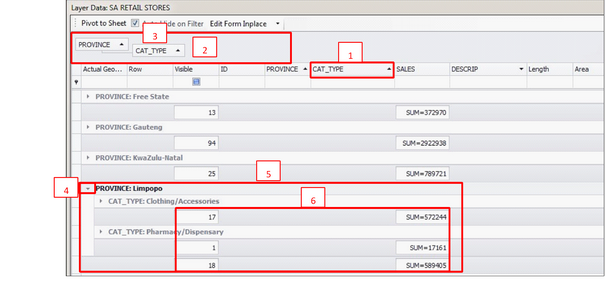
•To add another column to your group box, right click the column name (1) and click ‘Group By this Column’, or simply drag and drop the column name into the group box (2)
•Your first group will now be split into a second group
•E.g. in my example I added a second column Cat_Type (3) which will now split each province group into Cat_Type groups
•Click the drop down arrow next to any of the group names to expand and display your new groups ![]() (4). E.g. My Limpopo province group is now split into two Cat_Type groups:
(4). E.g. My Limpopo province group is now split into two Cat_Type groups:
1.Clothing/Accessories & 2.Pharmacy/Dispensary (5)
•Any total count/sum etc. will be split for the new groups (6).
•You can click the drop down arrow of any of the second groups to expand and display the rows
•You can select any row(s) in your Layer Data Grid, and highlight/zoom to these on your Map
To clear your groups at any time, right click the group box (1) and click ‘Clear Grouping’ (2)

1.12.8 How to copy data from the Layer Data Grid
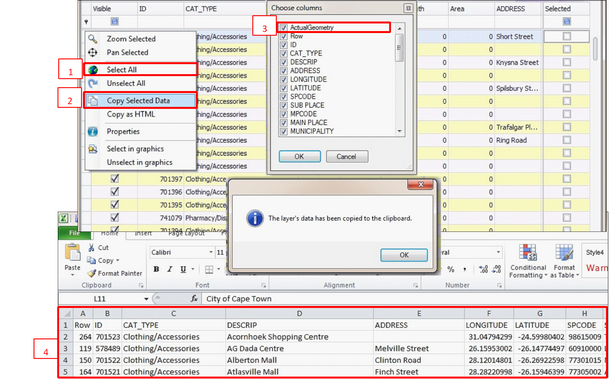
You can copy and paste all/selection of data to clipboard and paste the data to for example, an excel spreadsheet.
First select the data you want to copy:
1.To select all your data right click any row in your Grid and click ‘Select All’ (1) to select all rows
2.To select filtered data only, first filter the column(s) you want to copy and then right click any row in your Grid and click ‘Select All’ (1) to select all rows in your filter
3.To select a selection of rows, left click and hold shift/control to select the rows in your Grid
•Once you have selected your data, right click again and click ‘Copy Selected Data’ (2)
•Note, if the copy selected data button is greyed out, it means that this function was disabled when the reader file was created.
•A ‘Choose Columns’ box will appear where you can choose the columns you want to copy to clipboard. They are all ticked on as default.
•Tick off the first column ‘Actual Geometery’, as this will copy unnecessary columns (3)
•Click OK and your grid data will copy to clipboard
•Open excel and paste the data to a spreadsheet (4)
