Survey Window
❖ In the Surfaces tab of the Survey window you can also do some surface operations:
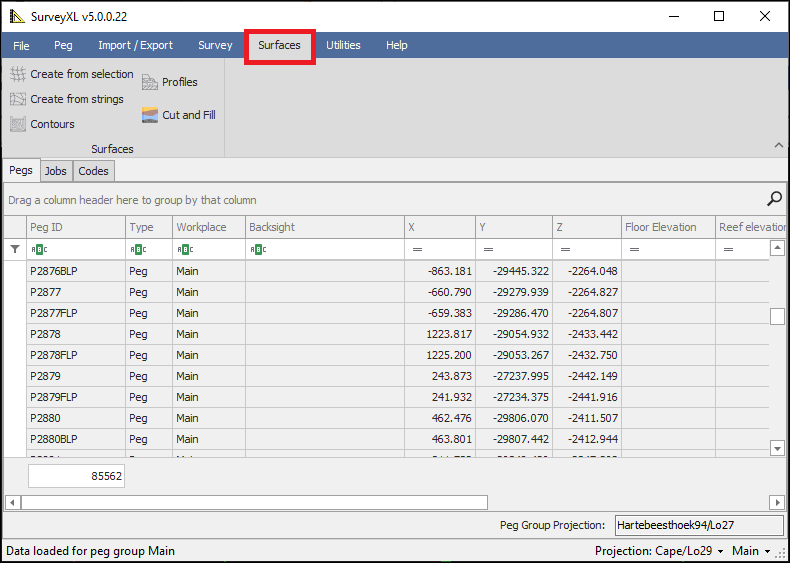
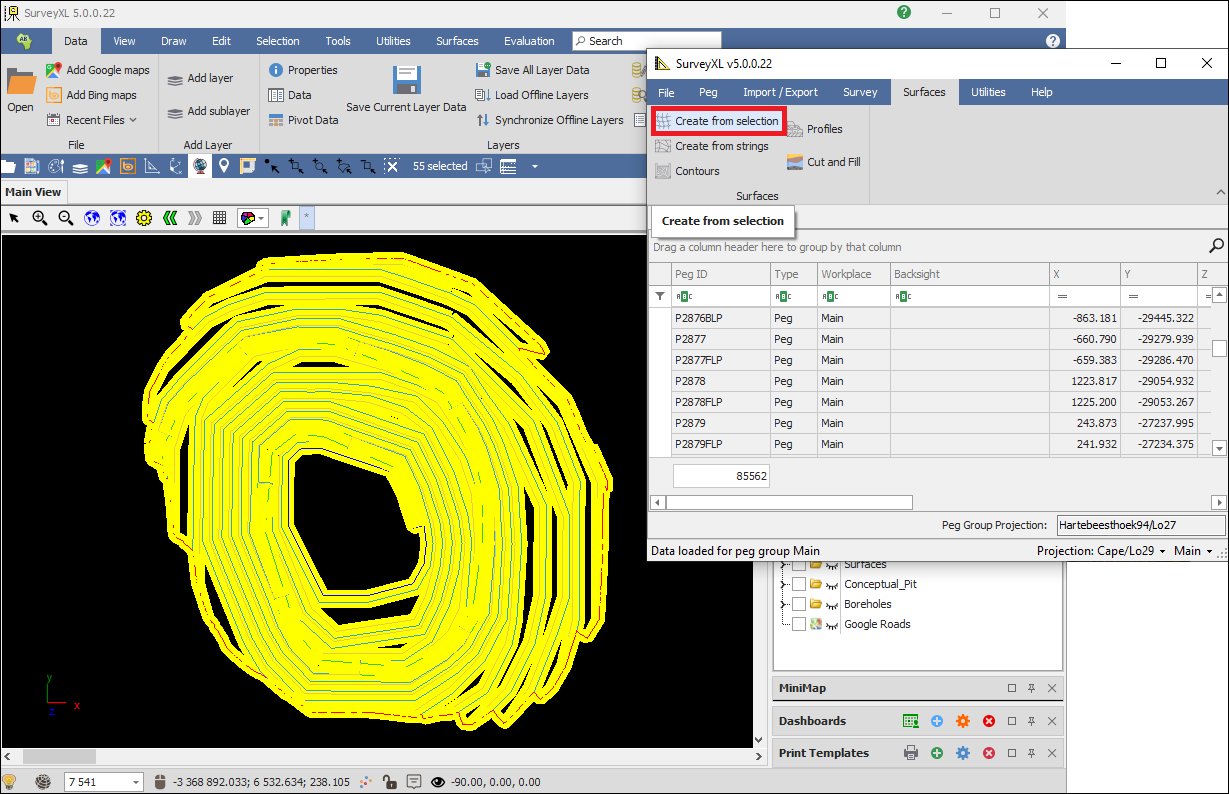
❖ Create from selection allows you to create a surface out of any selected elements, just select the elements in the scene using one of the selection tools then click on this button:
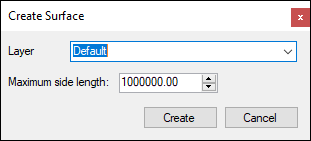
❖ You will be prompted to choose which layer the surface will be put in, you can choose an existing layer from the dropdown otherwise it will create a Default layer, you can change the name Default to something else if you want, then you can choose the Maximum side length for the surface as well, this will cause any triangles (in the triangulated surface) with sides greater than this value to be discarded,when done click Create:
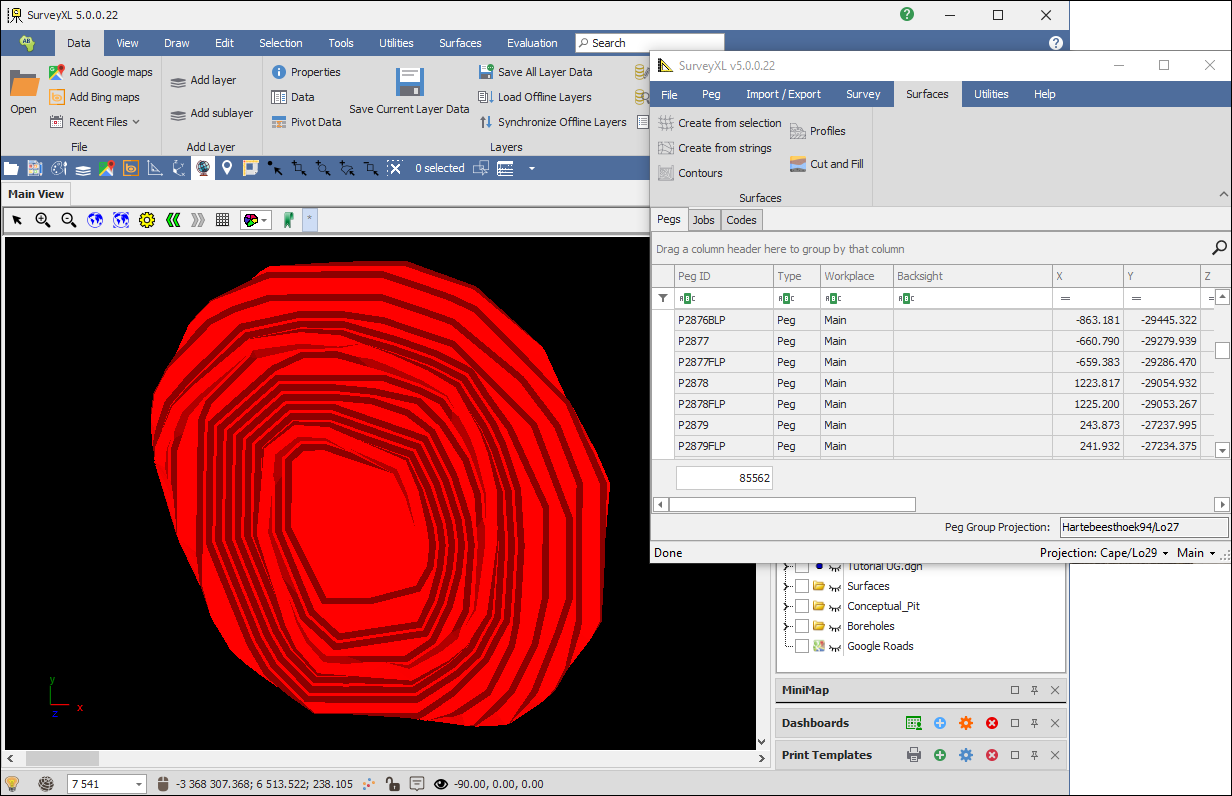
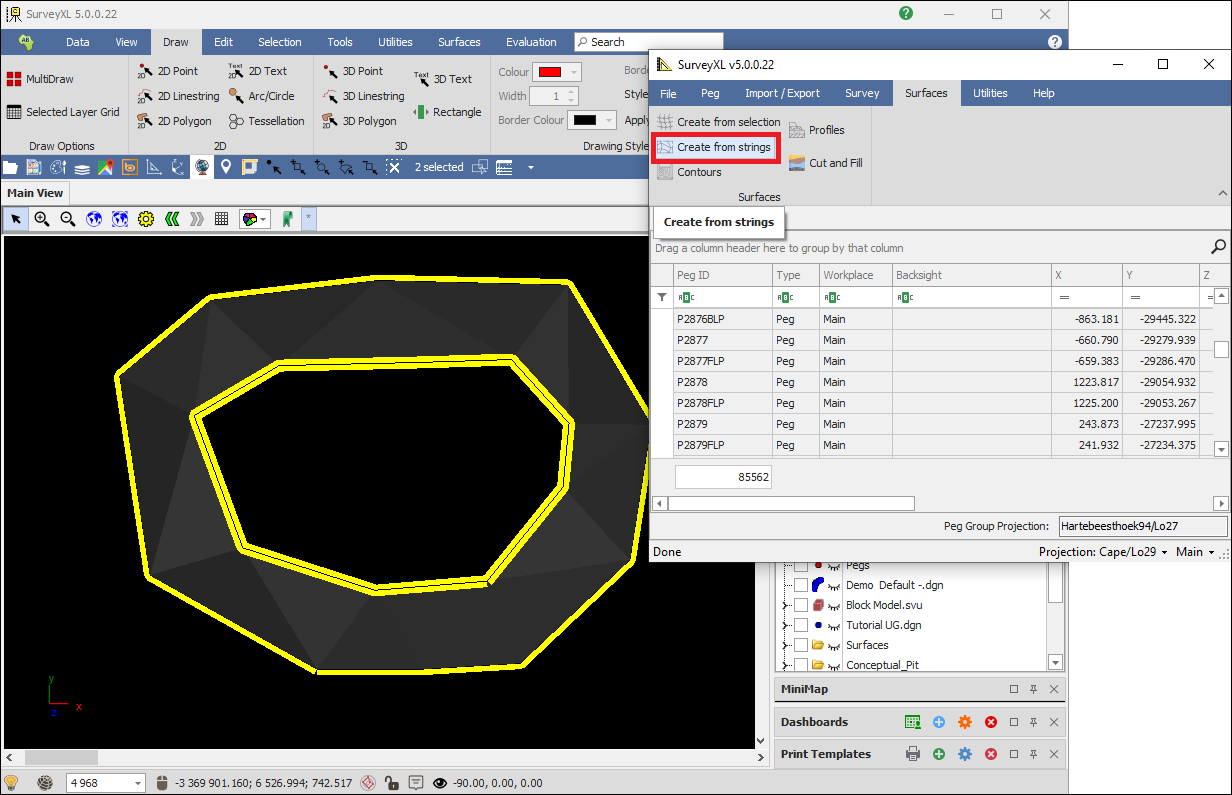
❖ Create from strings will create a surface between selected linestring elements, you will follow the same procedure:
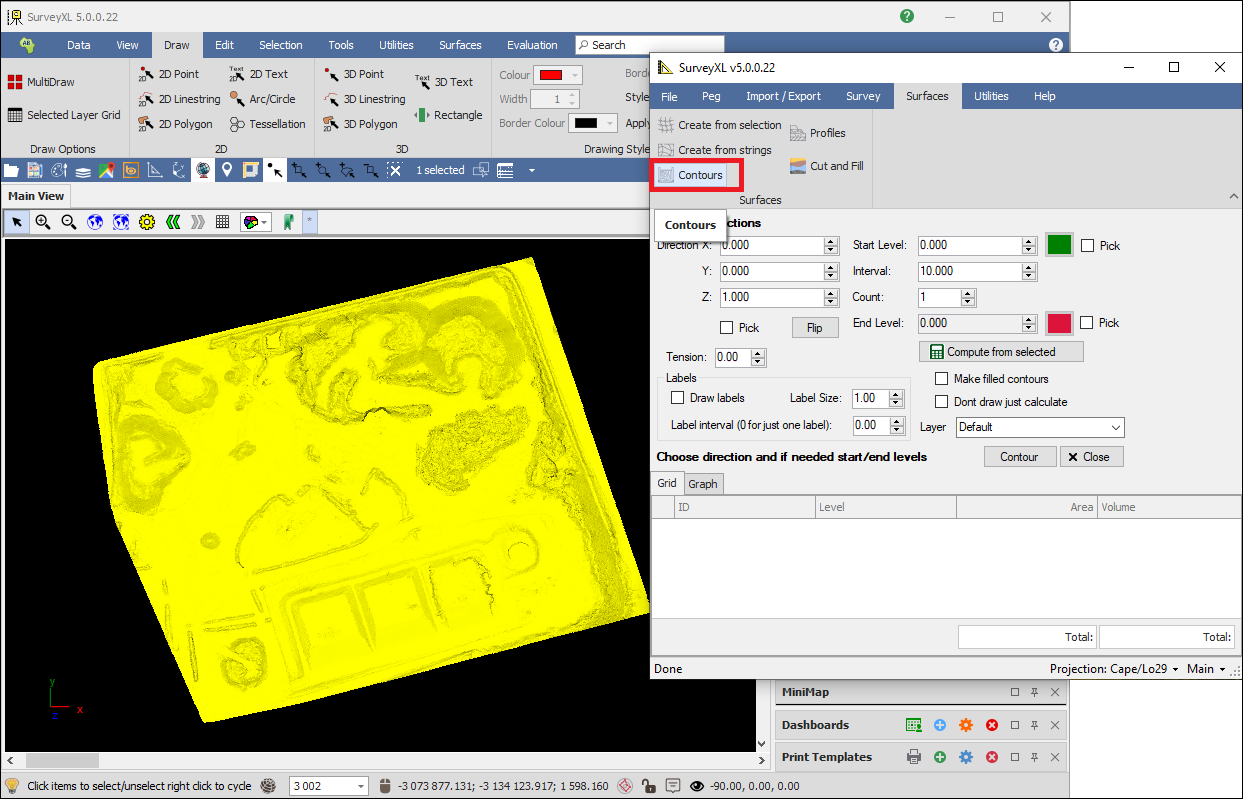
❖ In the Surfaces tab you can also do contouring of a surface. First select the surface with one of the selection tools then click on Contours, this will bring up the Contours/Sections dialogue:
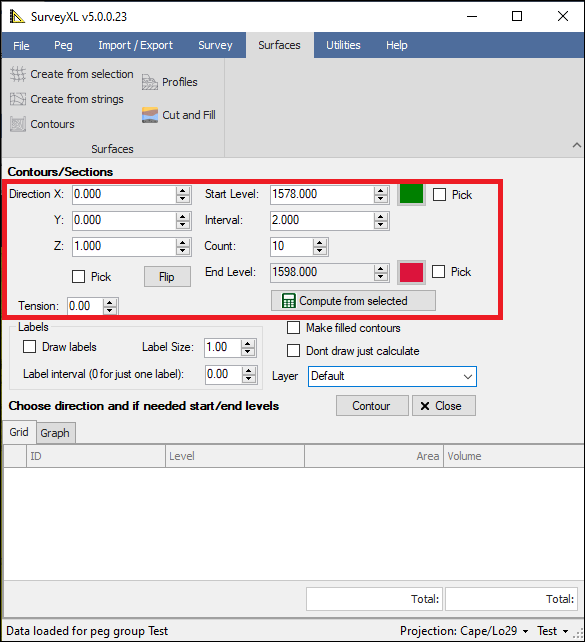
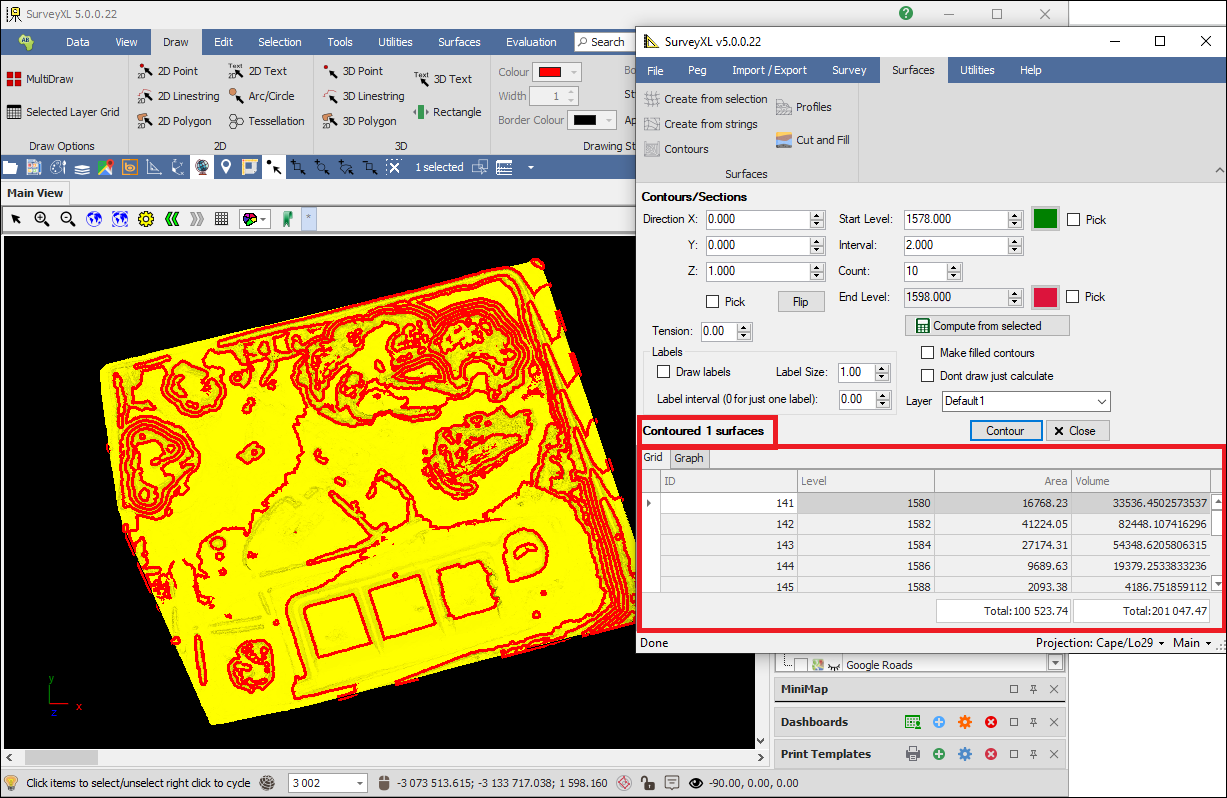
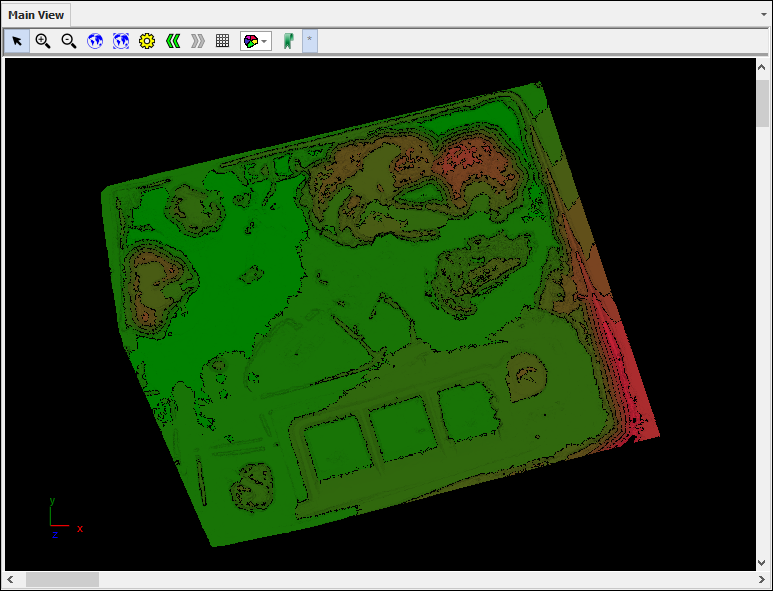
❖ You can then choose the Direction X,Y,Z for the contouring, you can enter it in manually or tick on Pick and then click in the scene to choose this, Flip will flip these values around.The Start Level, Interval which is the distance between each contour, Count, which is the number of contours and End level can all be entered in manually or you can tick on Pick and click in the scene to choose the Start and End Level, or you can just click on Compute from selected and this will be calculated for you and then you can adjust the Count or Interval as necessary. Beside Start Level and End Level are colours that you can change by clicking on them, these colours will change from one to the other as the contours proceed from the Start Level to the End Level, this is in the case of creating closed contours and gives a hill shading effect. Tension can be chosen as well for the contours, higher tension is straighter lines:
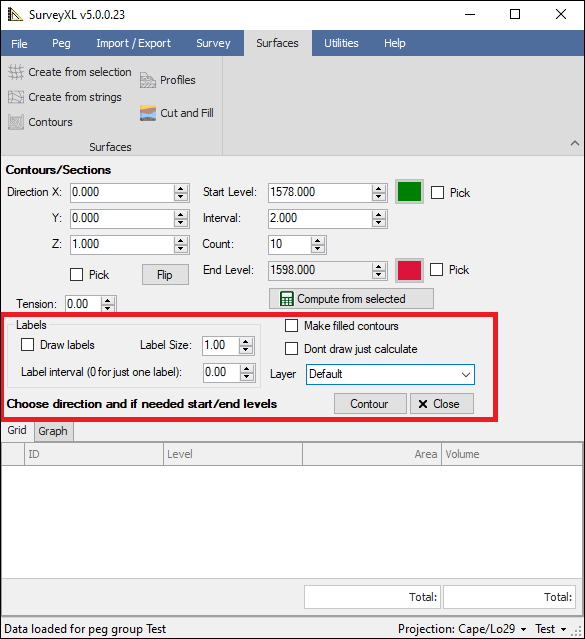
❖ You can then choose to have Labels (of each contour level) for the contours by clicking on Draw labels, you can choose the Label Size and interval. You can then choose the Layer that the contours will be drawn to by clicking on the dropdown or a Default layer will be created for you, you can change Default to some other name by typing it in. Then if you want filled contours(polygons) then you can click on Make filled contours.If you don't want the contours to be drawn but just want to calculate them you can click on Don't draw just calculate. When you are done setting everything you can then click Contour:
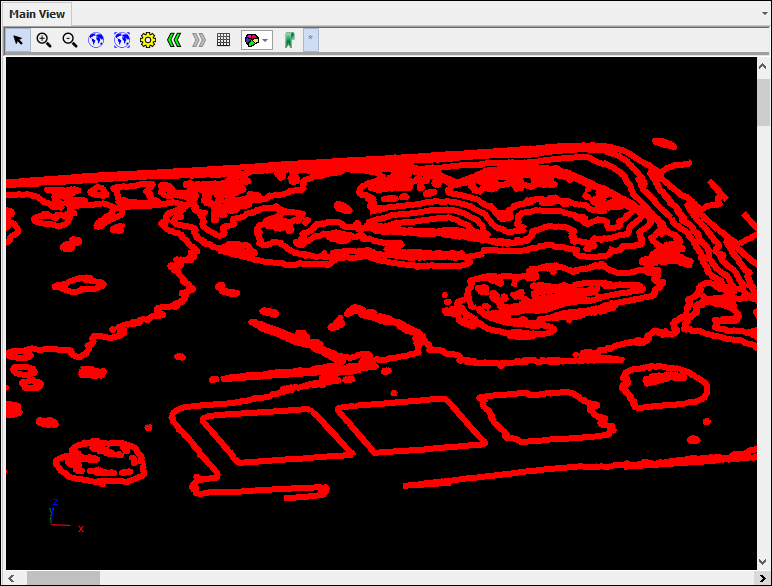
❖ The surface has now been contoured and the resulting contours are drawn to the scene and the data for each contour is populated in the grid below:
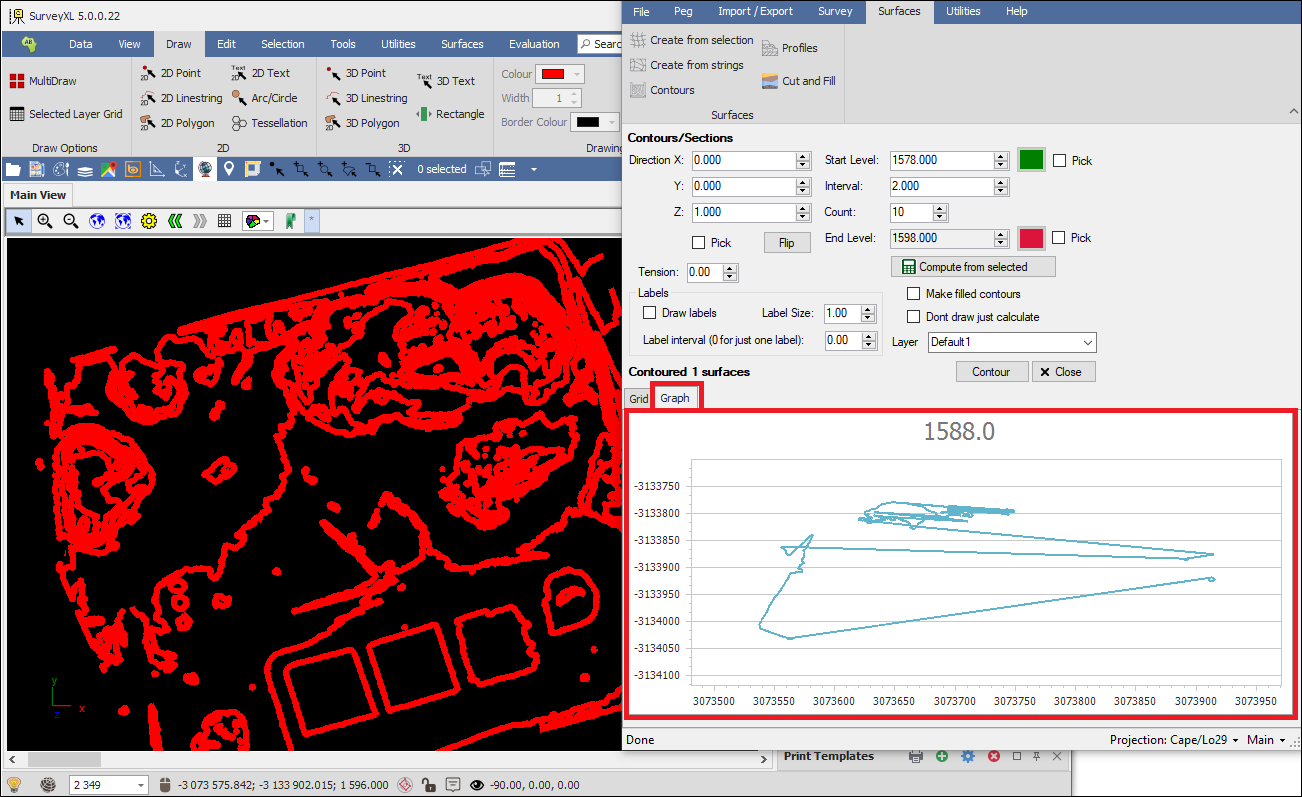
❖ You can see a graph of the contouring as well in the Graph tab:
❖ This is how the contouring looks with closed contours (polygons):
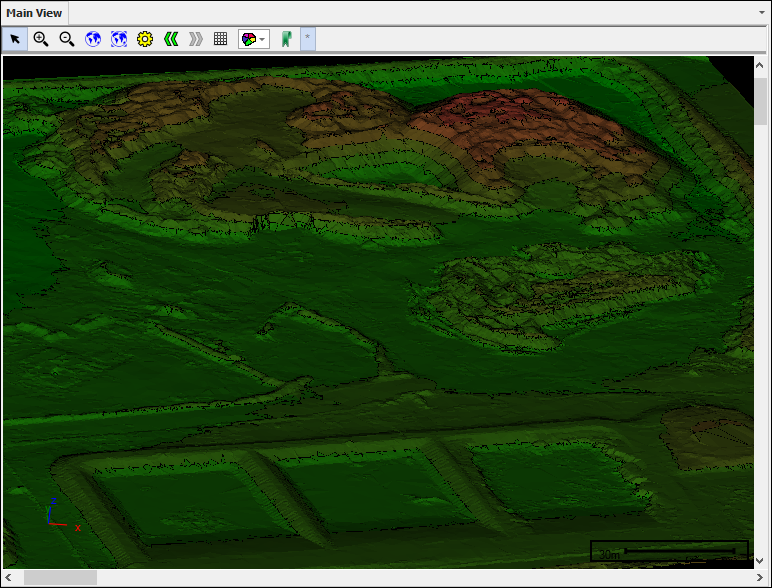
❖ The Profiles tool is used to create a graphic representation of the outline of a surface. It only works with surfaces however it can be used on a set of points representing a surface and it will triangulate the points for you in the background into a surface so as to make the profile. In this example I will be using a set of points which represent an area of stockpiles at a mine:
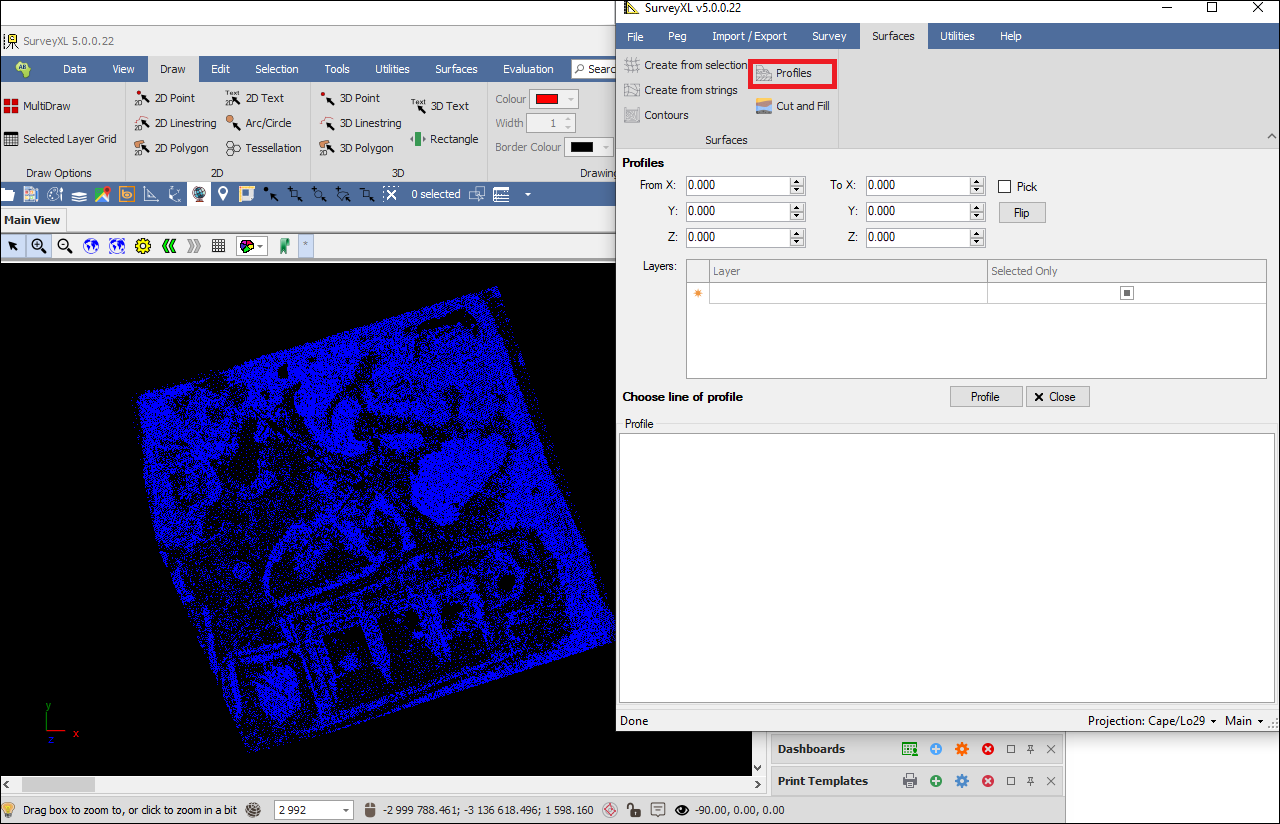
❖ Clicking on the tool brings up the Profiles dialogue, start by ticking on the Pick box and then choose the beginning point of your profile line by clicking in the scene on your surface. The coordinates of this point will populate in the From X,Y,Z area:
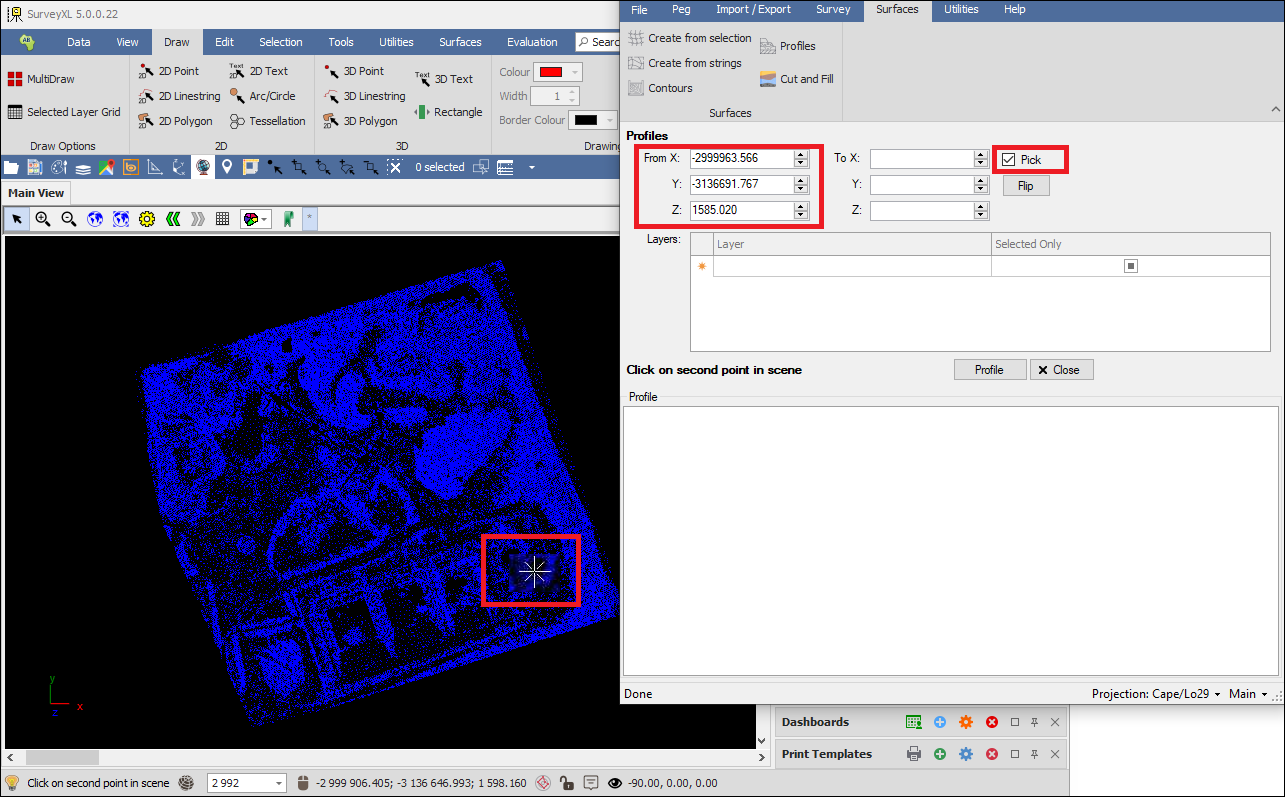
❖ Then choose the end point in the scene by once again clicking at the desired point in the scene and the To X,Y,Z will also be populated now:
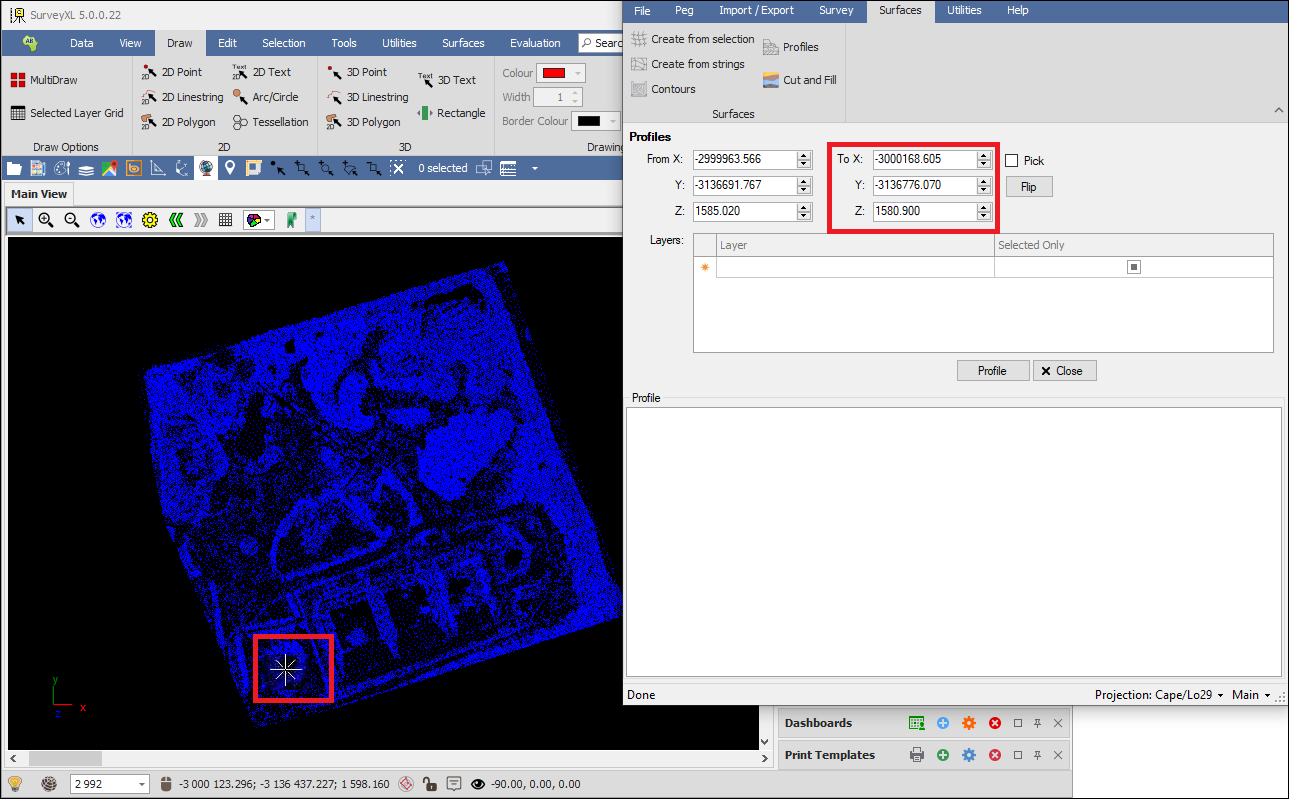
❖ In the Layers area below choose which layer/s you are doing this on. Selected Only can be ticked on if you want the profile to be drawn over selected elements only. When done click Profile:
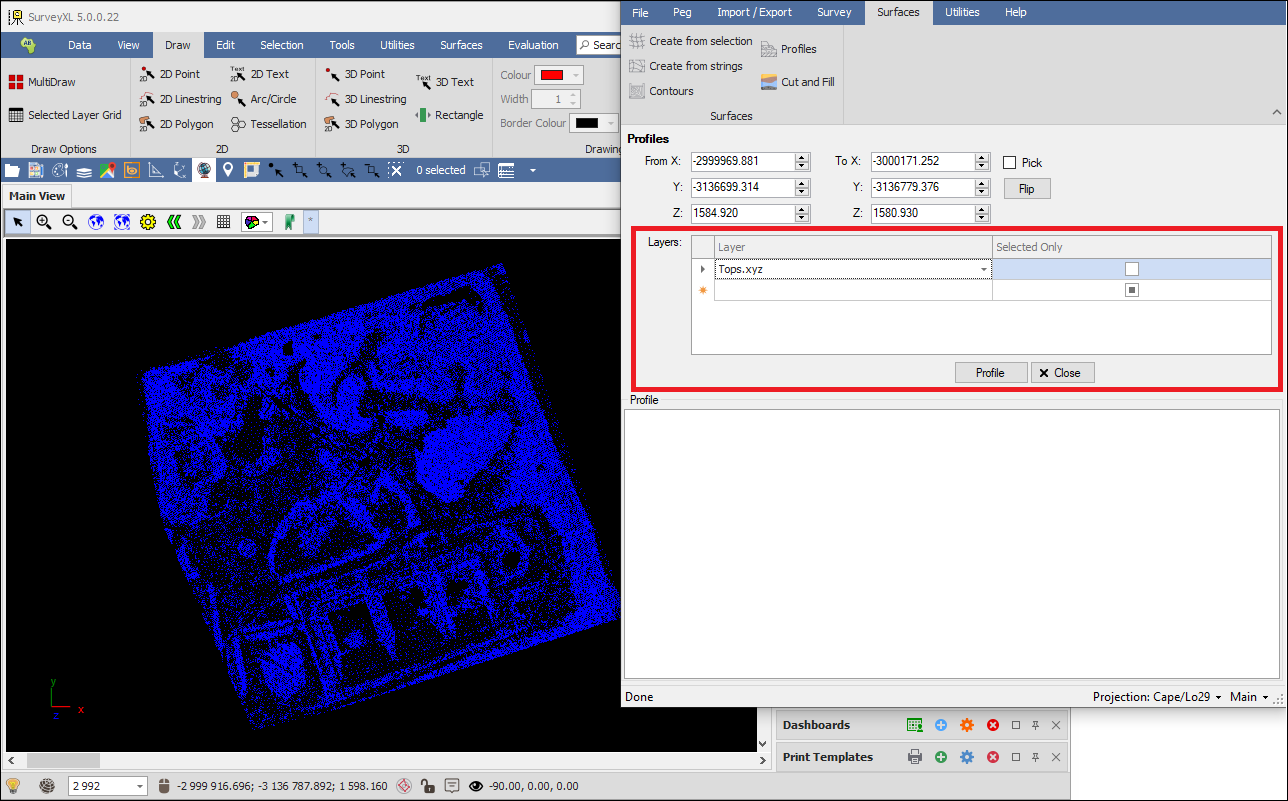
❖ Your profile has now been created:
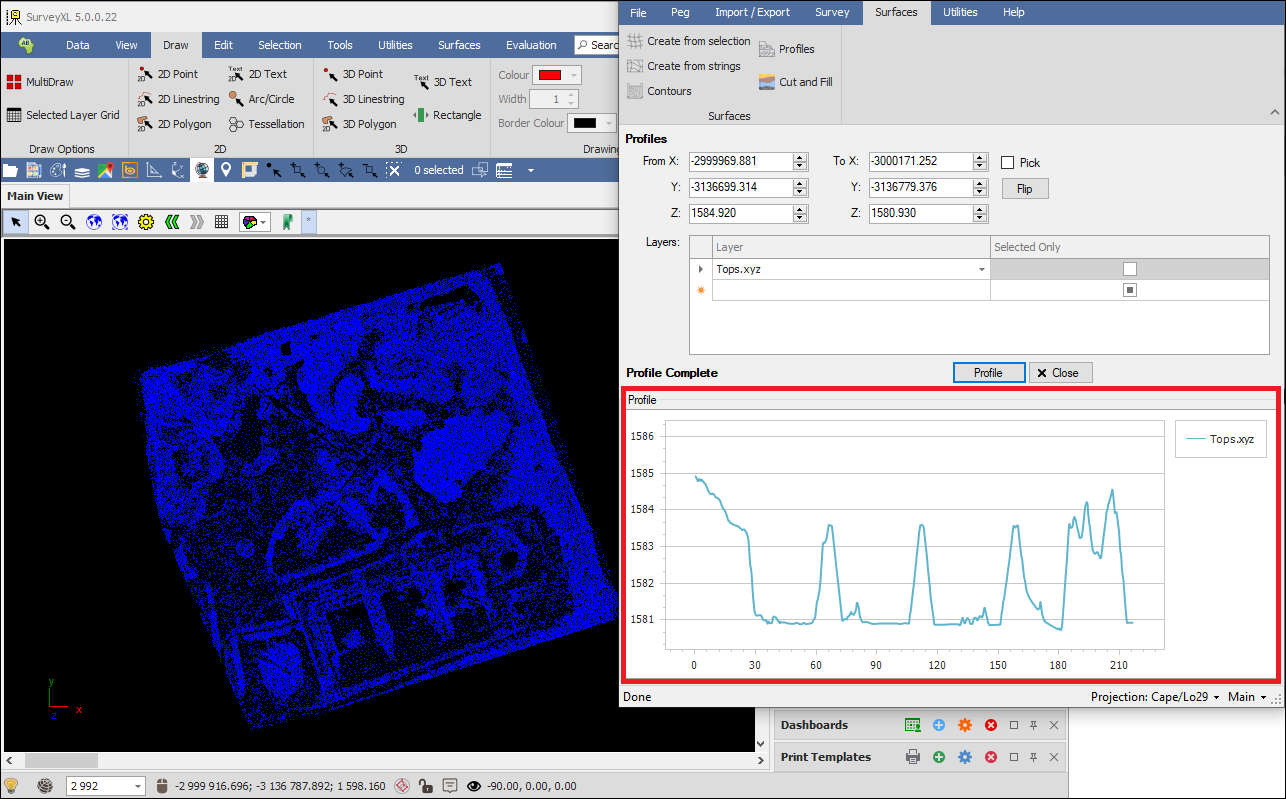
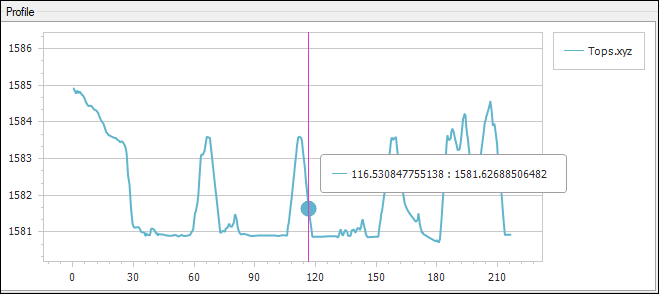
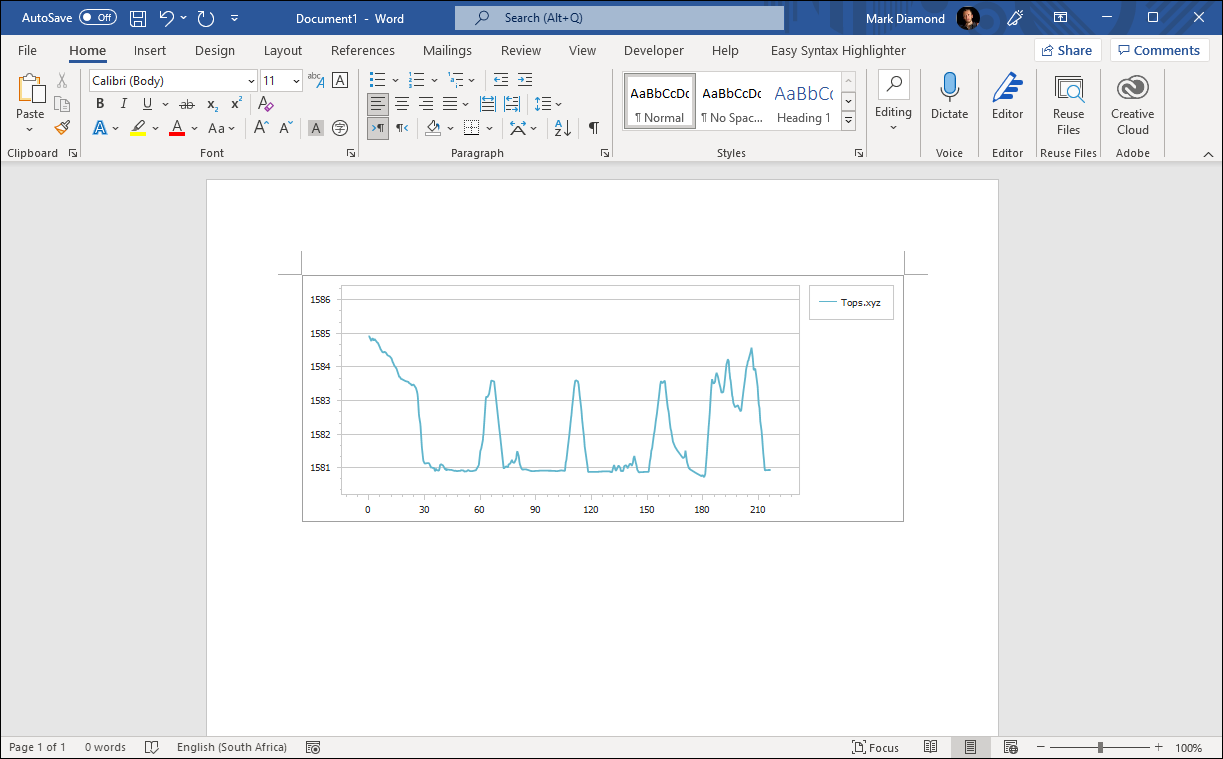
On the Y axis of the graph are the height values in meters of your profile line and on the X axis are the distances in meters at each point along the line. By hovering over the profile at any point you can see these values precisely:
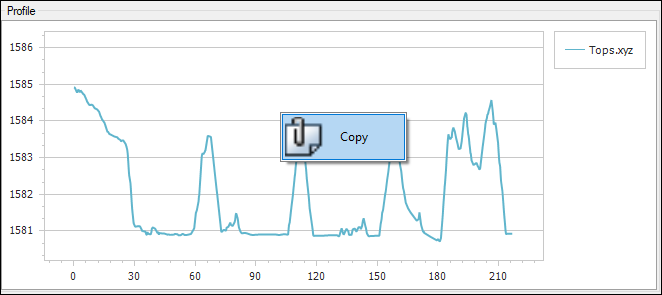
❖ What you can do also is right click on the profile and Copy. You can then paste the profile somewhere else like in a Word document for example:
❖ Cut and Fill works the same as in the SurveyXL Window.