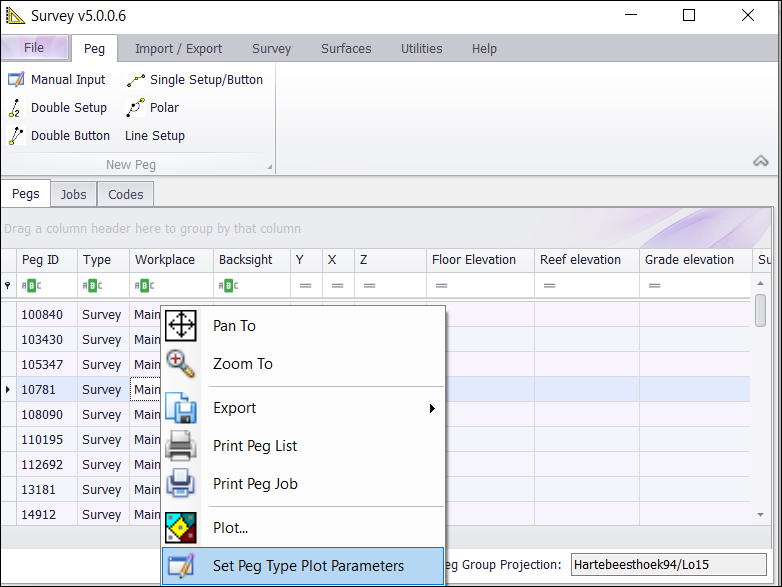
❖Right click in the Pegs area and select Set Peg Type Plot Parameters – you may need Survey Administrator privileges to do this depending on your settings.
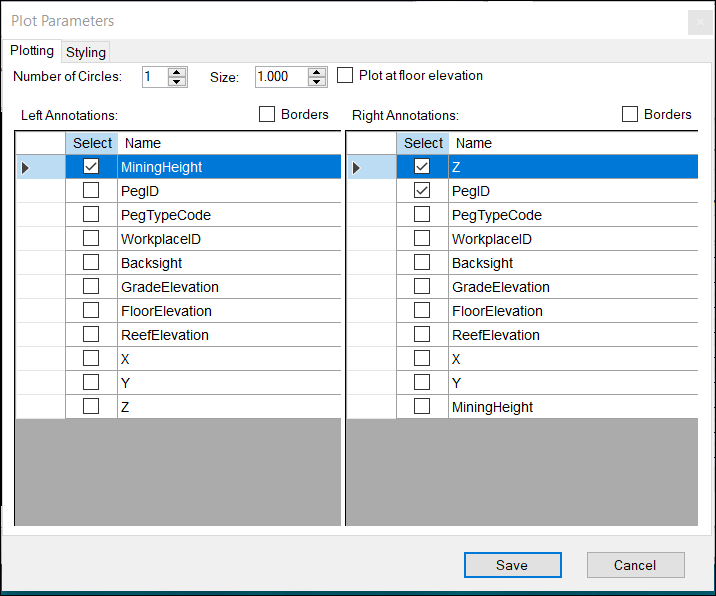
❖In the Plotting tab these are the default settings of the Left and Right Annotations about your pegs. Adjust, as necessary.
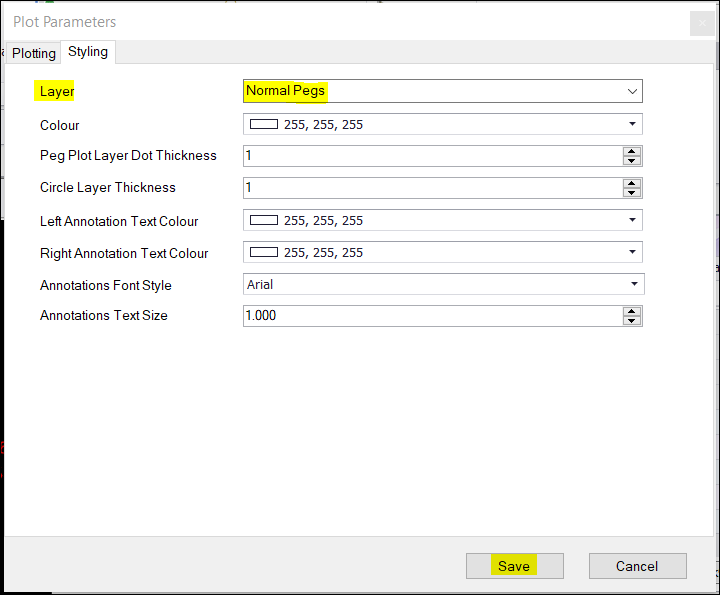
❖Go to your Styling tab. These are also the default settings for your pegs styling, and you can adjust it, as necessary. (Note: You need to specify what Layer your pegs will be plotted to – normally you just create a name of the layer. Normal Pegs it is in this example.)
❖Click Save when you are done.
❖To plot your pegs now, right click on a row, and select Plot.
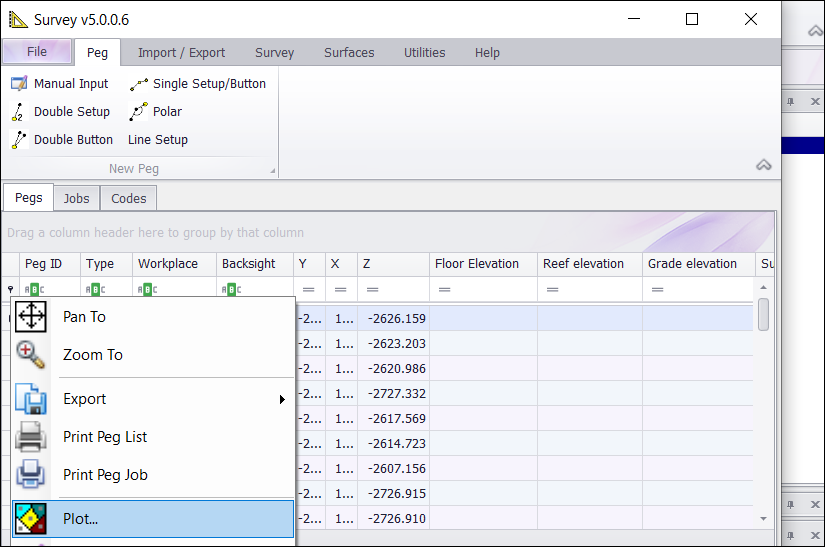
❖At the bottom left of your window you will see how many pegs were plotted.

❖To plot all your pegs at once, follow the above steps but this time select all your pegs instead of one row and select Plot.
❖Your pegs will now be plotted in your scene in the SurveyXL window. A layer Normal Pegs will be added.
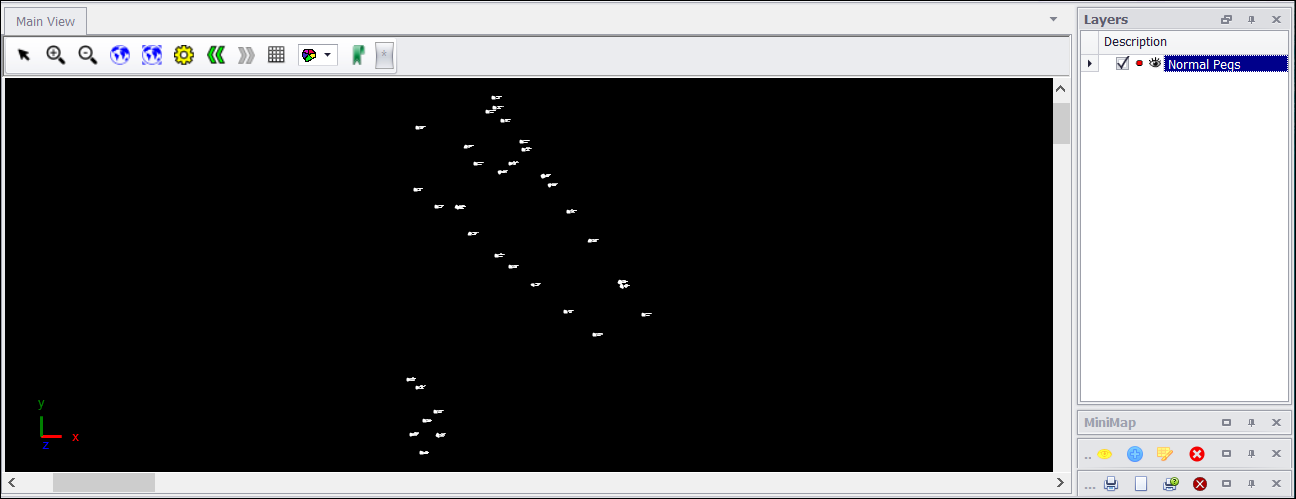
❖Right click on the layer and select Zoom fit. The view extent as the screenshot above is to all your pegs plotted.
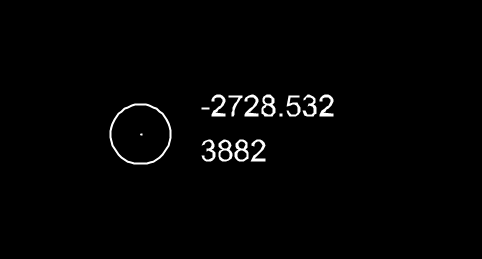
❖Zoom in to one of your pegs by scrolling your mouse wheel etc to see the annotations and styling you had set up for your pegs. As you will see, MiningHeight is not populated as the left annotation that was set up. This is because there is no MiningHeight data in the pegs.
❖You can see where your pegs are in space on Google Roads and Bing Satellite by setting the following:
1.At the bottom of your SurveyXL window, click on the mouse.

The above are the X, Y, and Z values respectively of your pegs. The highlighted is your Z value which indicates that your pegs are almost 3km below the surface. I will set this value to be 0 so you can see where your pegs are on the surface allowing Google Roads and Bing Satellite to display.
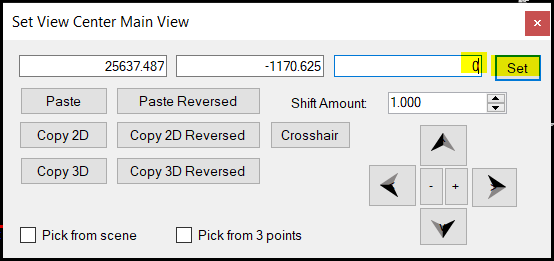
2.Type in 0 for the Z value and click Set. Then close this window.

There are now only X and Y values present assuming you are now in a 2D world.
Add your Google Roads or Bing Satellite layer. You will now see exactly where your pegs are in relation to the earth’s surface.
3.Click on the Bing Satellite icon on the shortcut ribbon. Zoom out of your pegs to see where they are. In this example they are in the Democratic Republic of Congo – the scene projection may be incorrect for these pegs, but this is just a demonstration. (Toggle the Google Roads and Bing Satellite icons in the shortcut ribbon.)
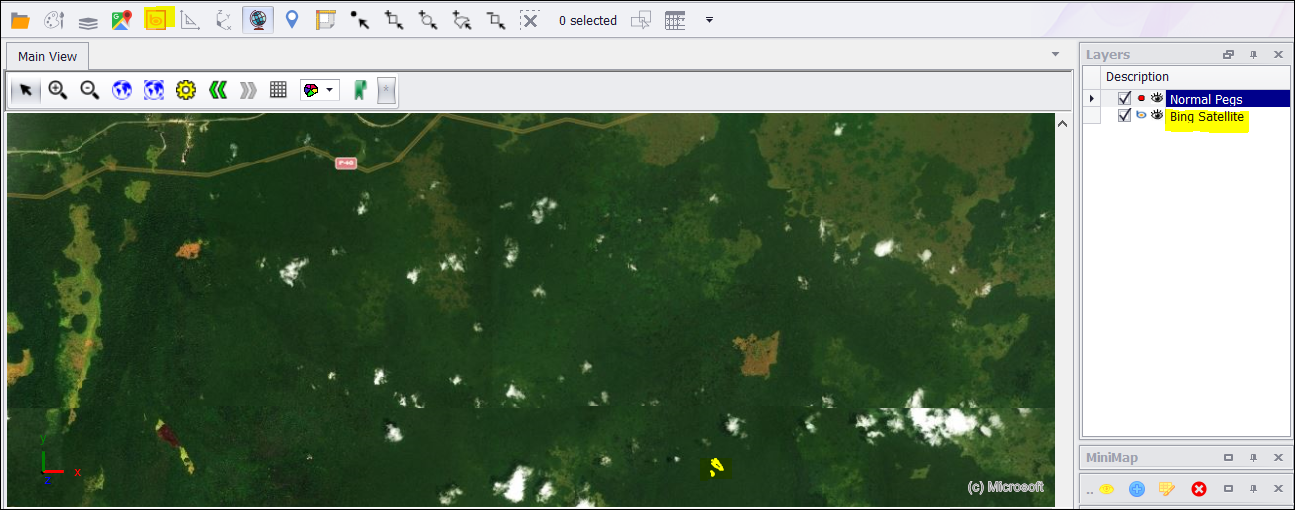
The yellow highlighted area on the scene is where the pegs are.