Pivot Tables in SpatialXL
❖Pivot Tables can be linked to the spatial scene in SpatialXL and then be worked with and filtered with the scene updating accordingly.
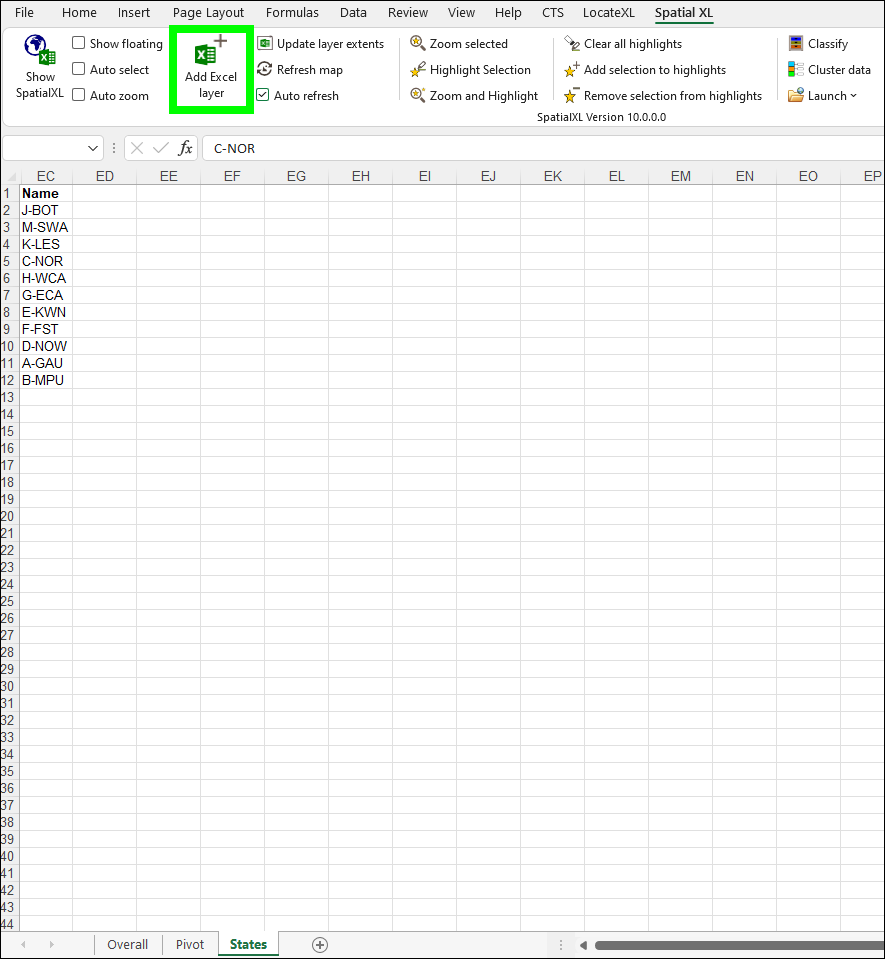
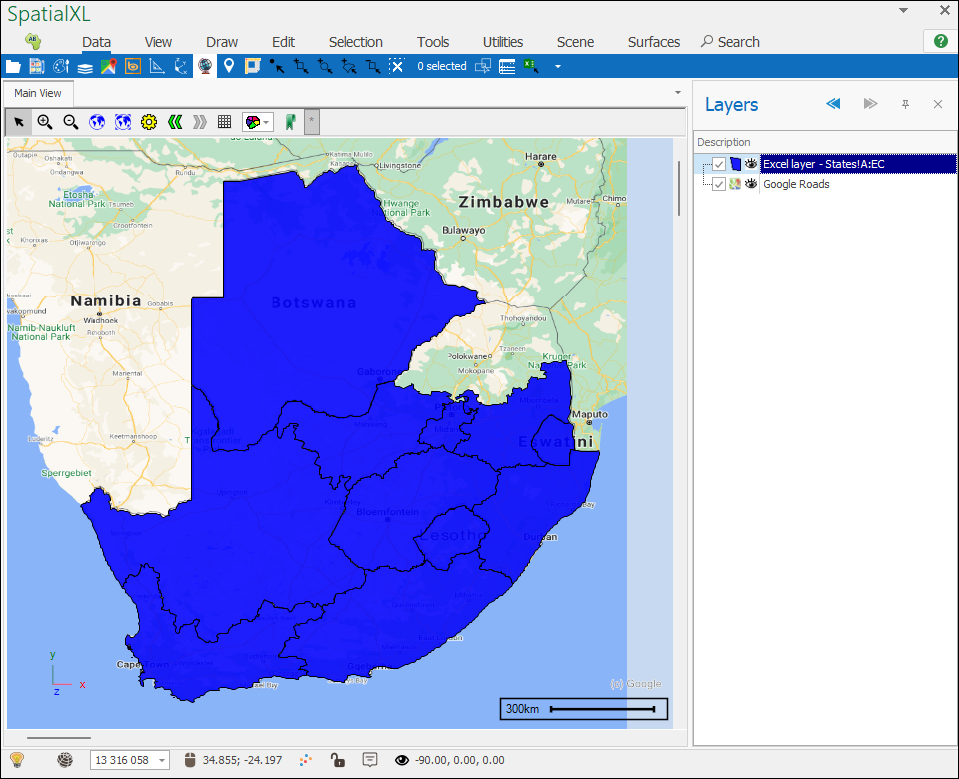
❖First, you would have a layer with geometries in the spatial scene, this layer would have some column with common values to values in the pivot table you will be adding, in this example I have a sheet of some States that I have added as a layer:
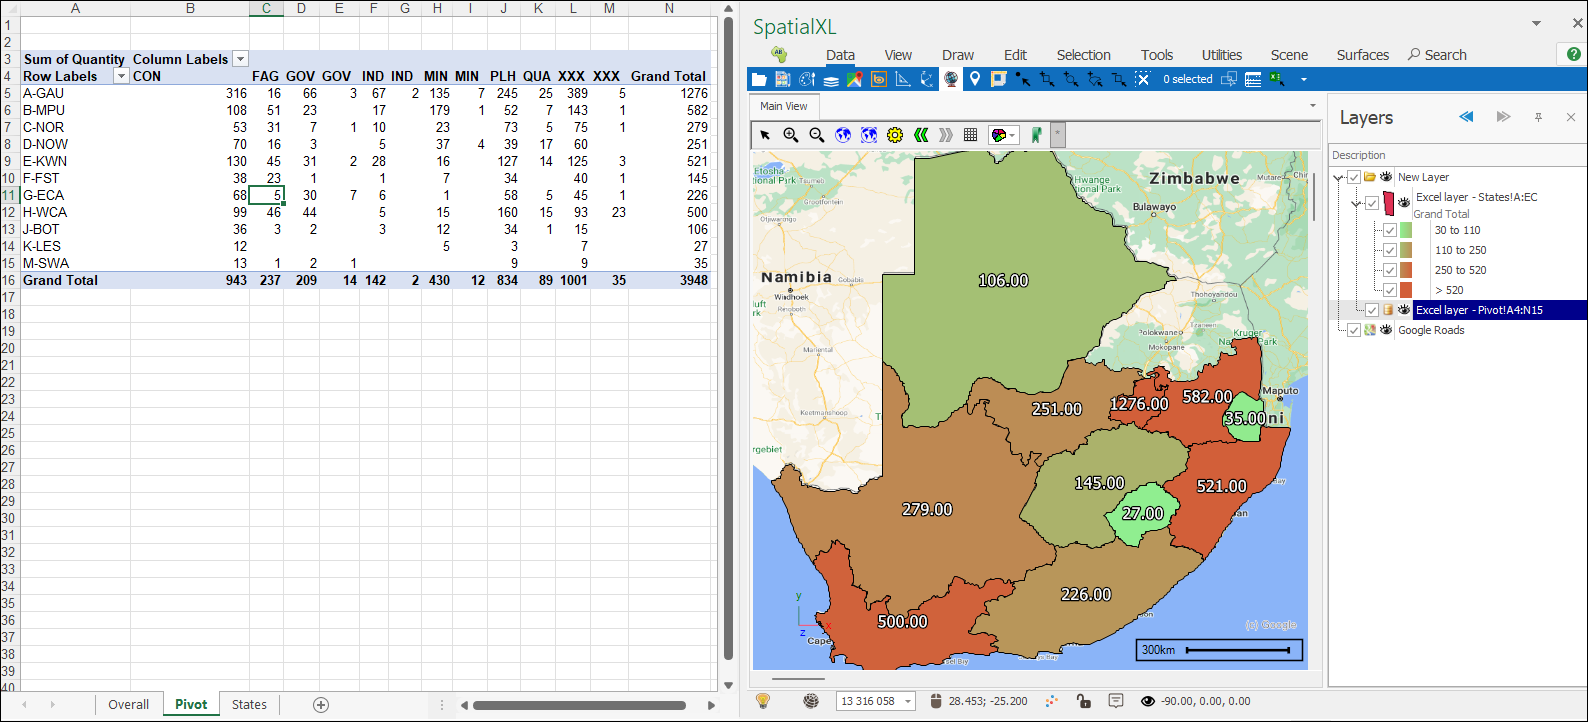
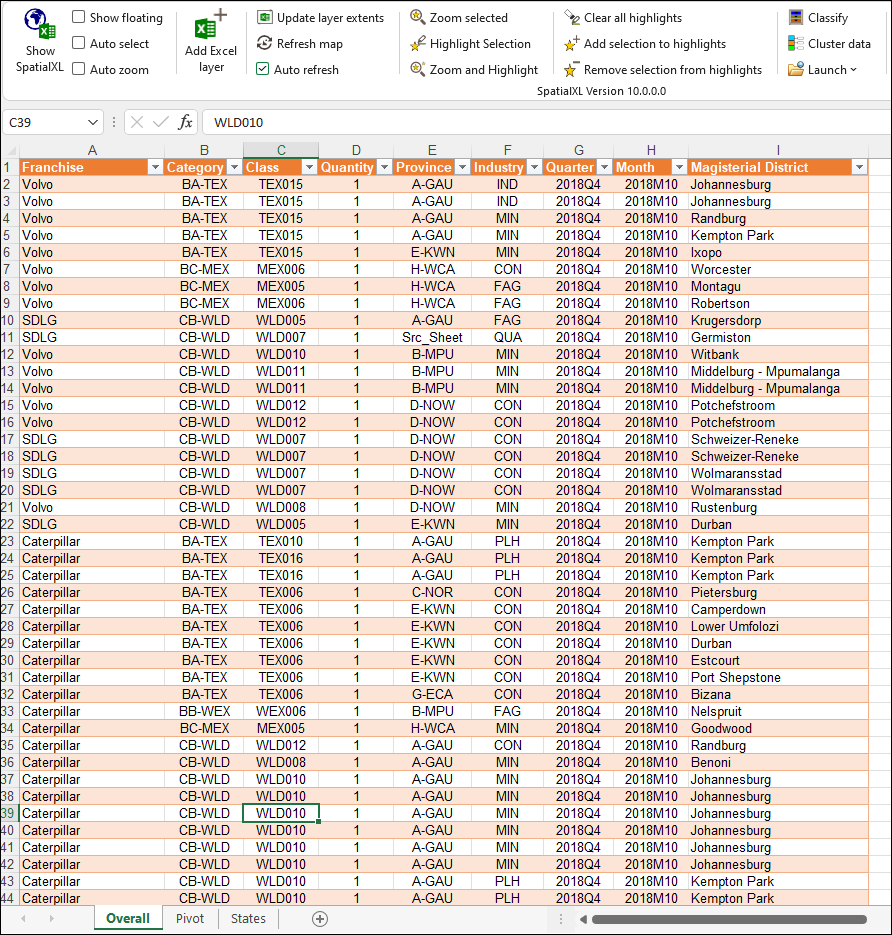
❖Next, I have my pivot sheet, which I created based on data in my Overall sheet:
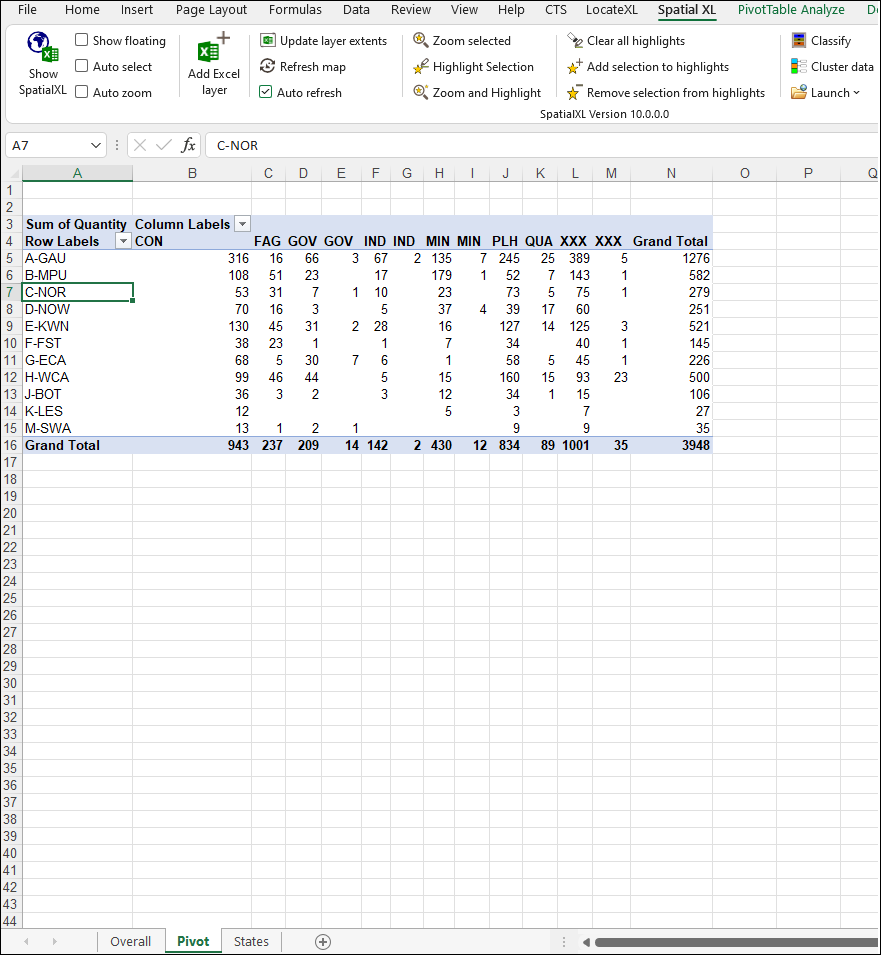
The pivot must have the common values with geometries layer put as row labels, which in this example is the State names. I then added the Industry column in my source sheet as column headers and then did a Sum of the Quantity column:
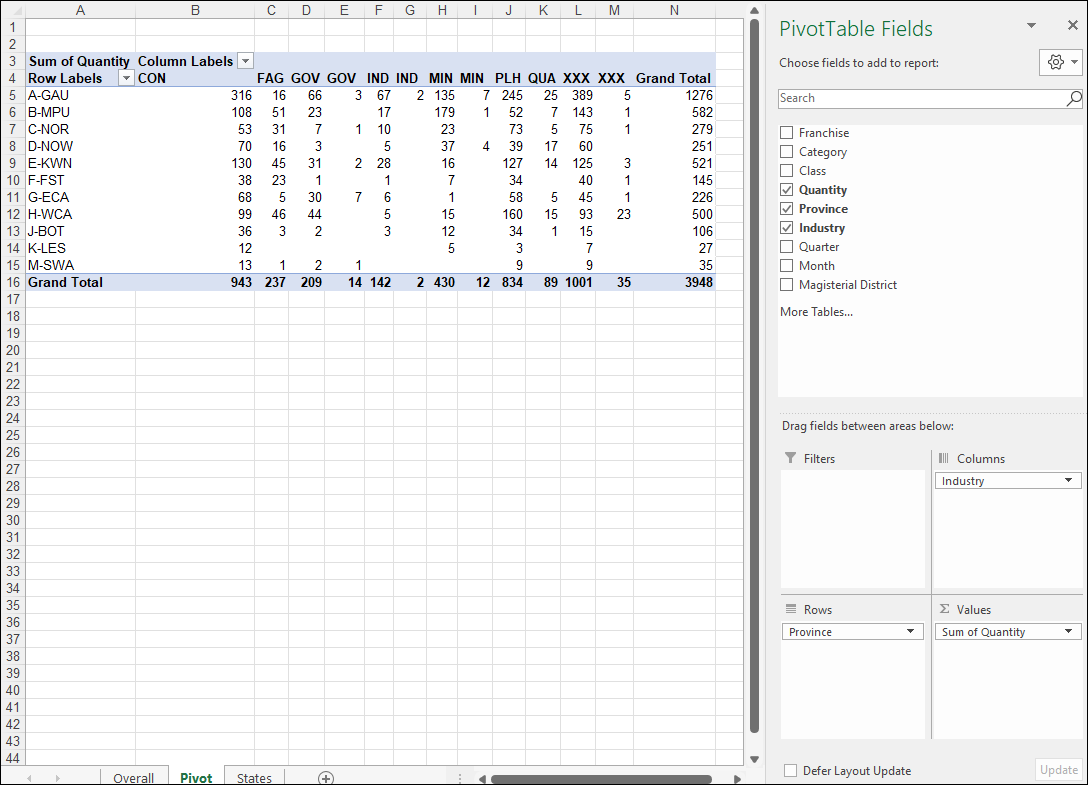
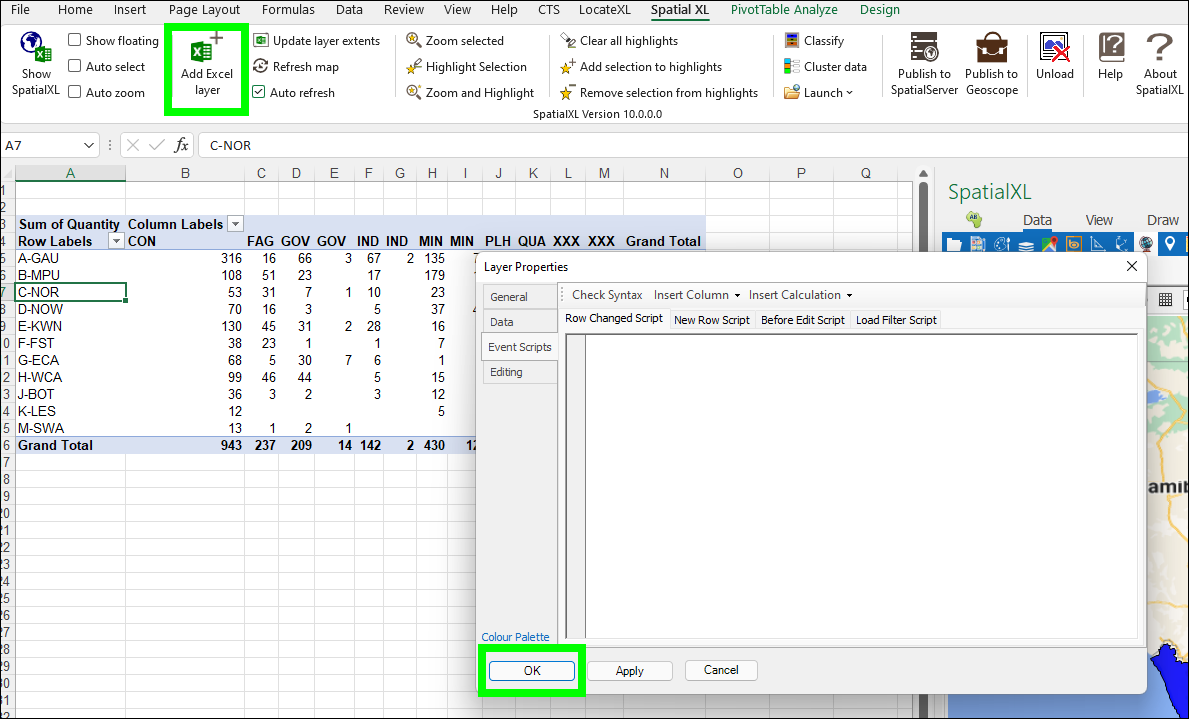
❖Add the pivot as a layer in SpatialXL (It will be non-display of course as it just holds data and no geometries):
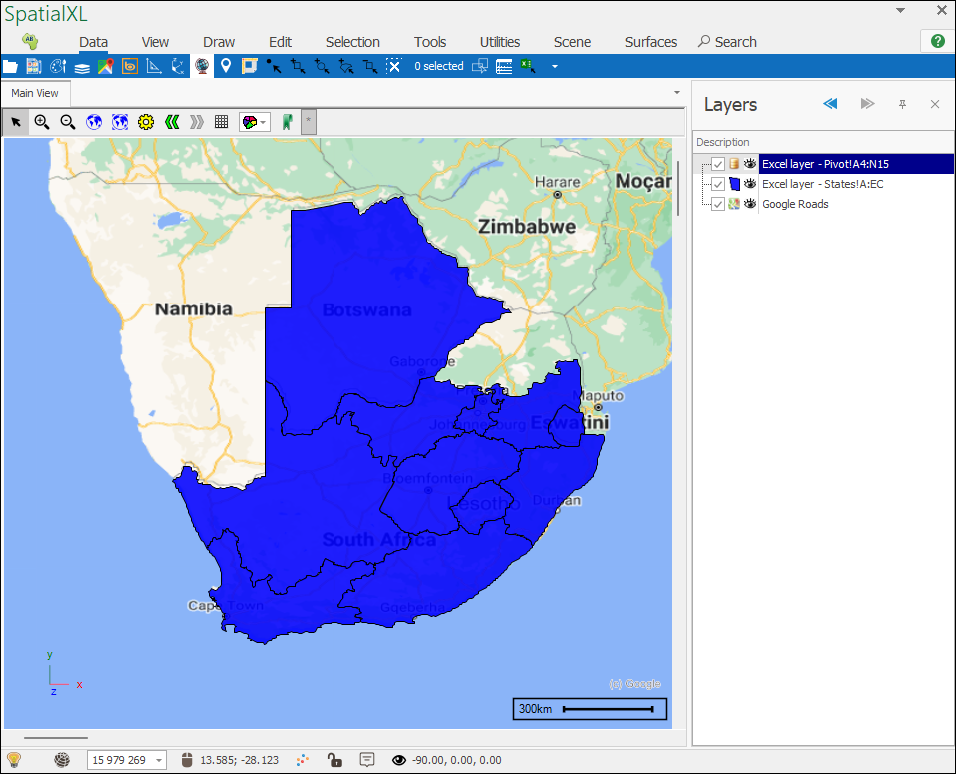
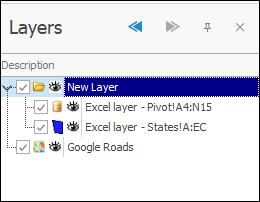
❖Now, we will create a data link between the Pivot layer and the States layer using Relations (see Relations manual for full data on how this tool works). To create relations between layers they must be under the same top-level layer, so we will create a new empty layer to contain these two layers, and then place them inside it:
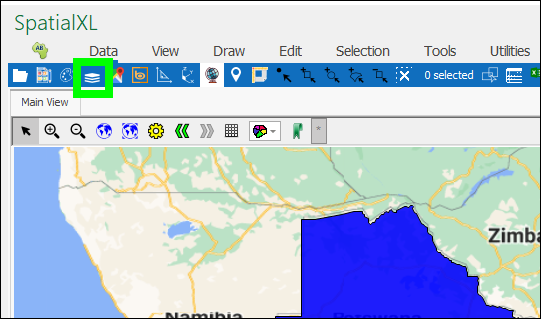
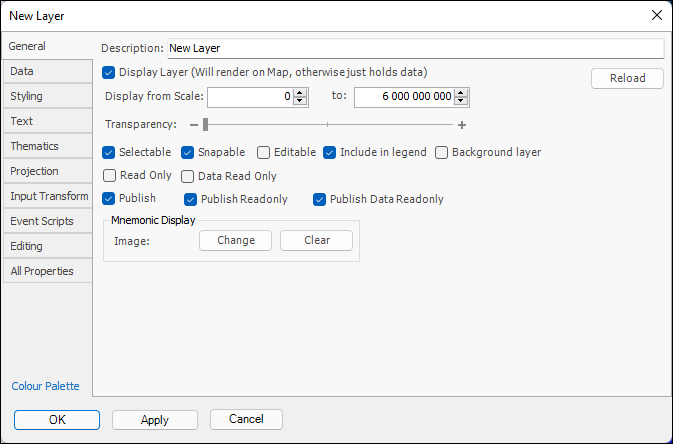
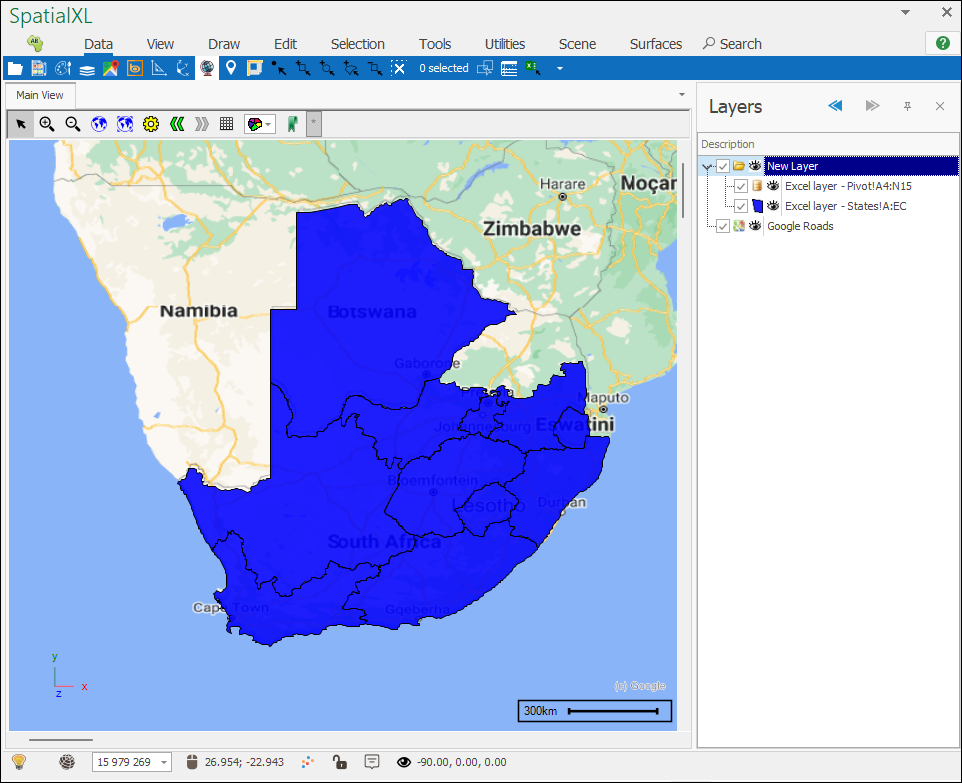
❖Now, make sure the top-level layer is highlighted in the layer control then open the Relations tool:
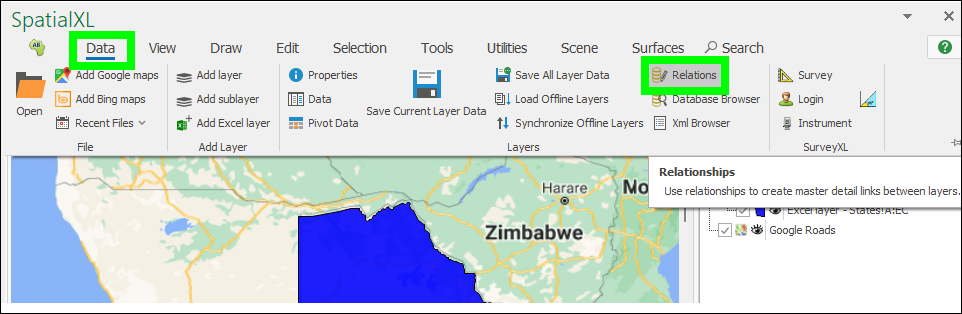
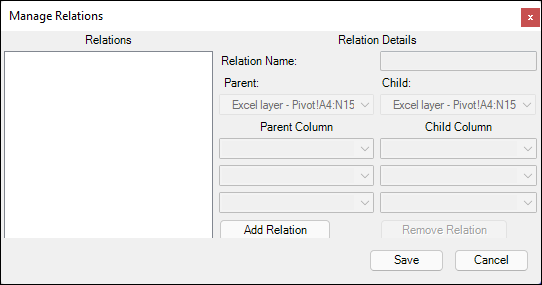
❖Then, create the relation between the two layers by linking on the columns with common values, which is the Row Labels in my Pivot layer and the Name column in my States layer. The Pivot will be the Parent layer and the States layer will be the Child layer:
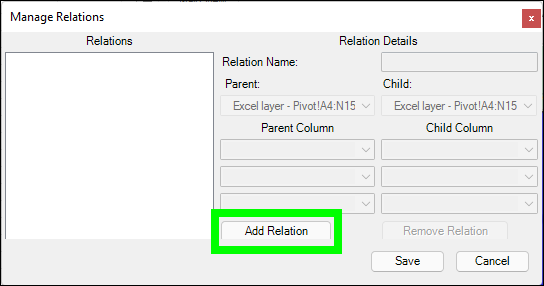
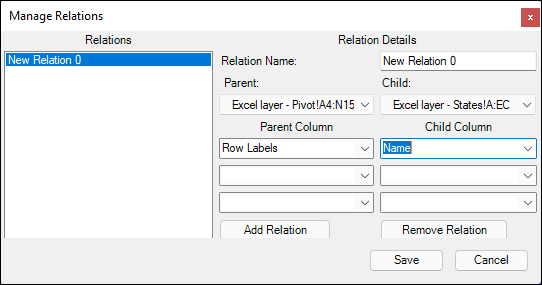
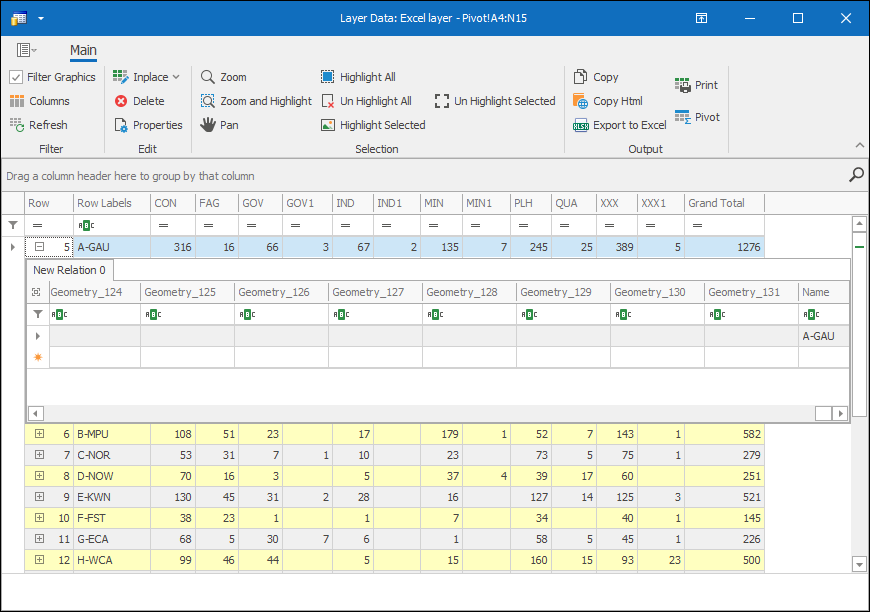
❖Then click Save and the relation has been created, if you view the Layer Data Grid of the Pivot layer you will see the rows now have children from the states layer linked to them:
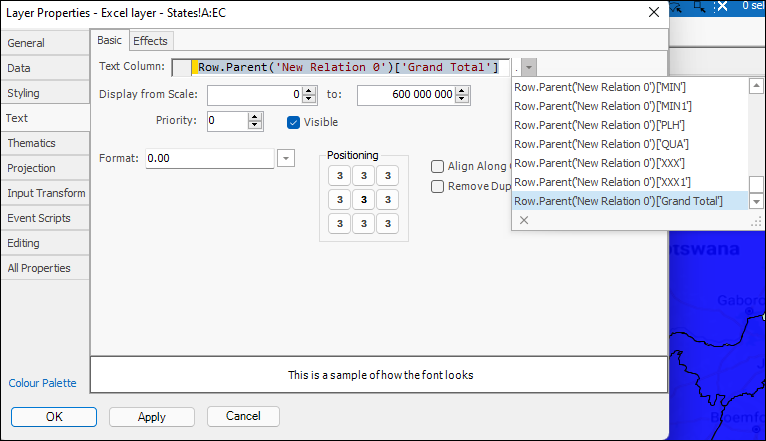
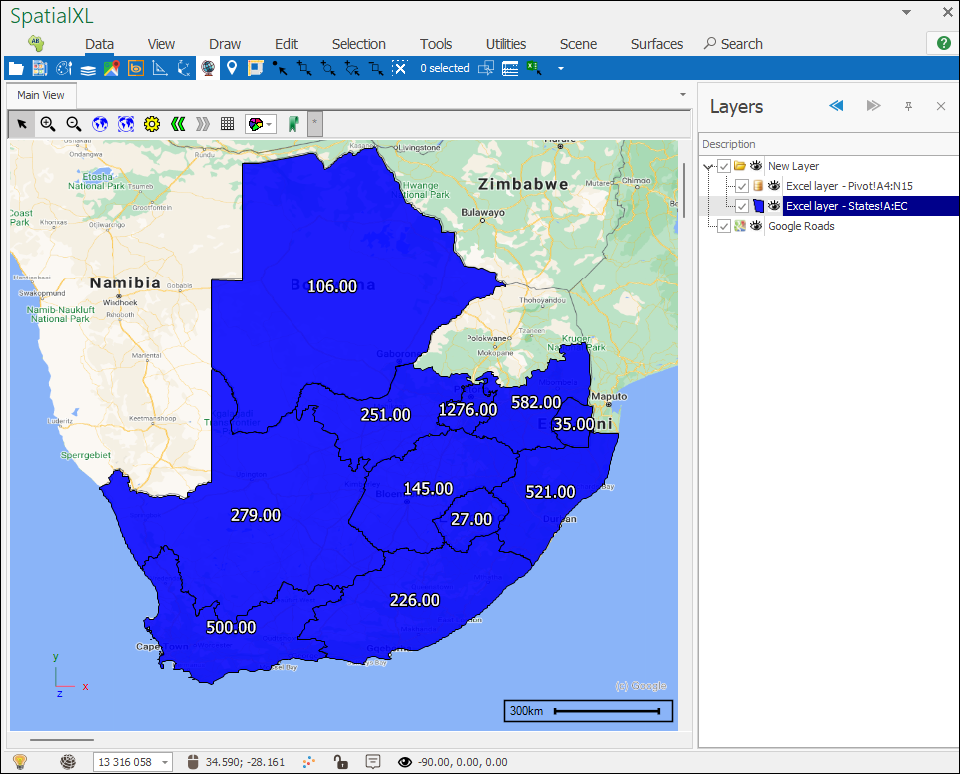
❖Now that your pivot is linked to your layer with geometries you can apply text labels and themes on this relation. For example, here I will apply a text label on the Grand Total column from the parent Pivot layer:
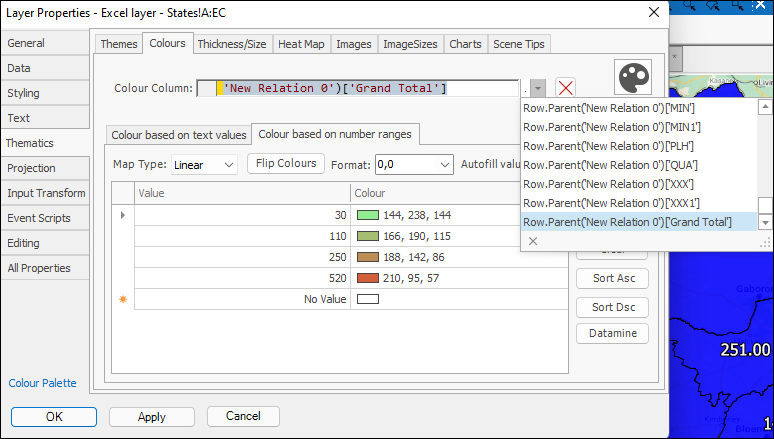
❖I can also create a theme on this relation, I will theme on the Grand Total column as well:
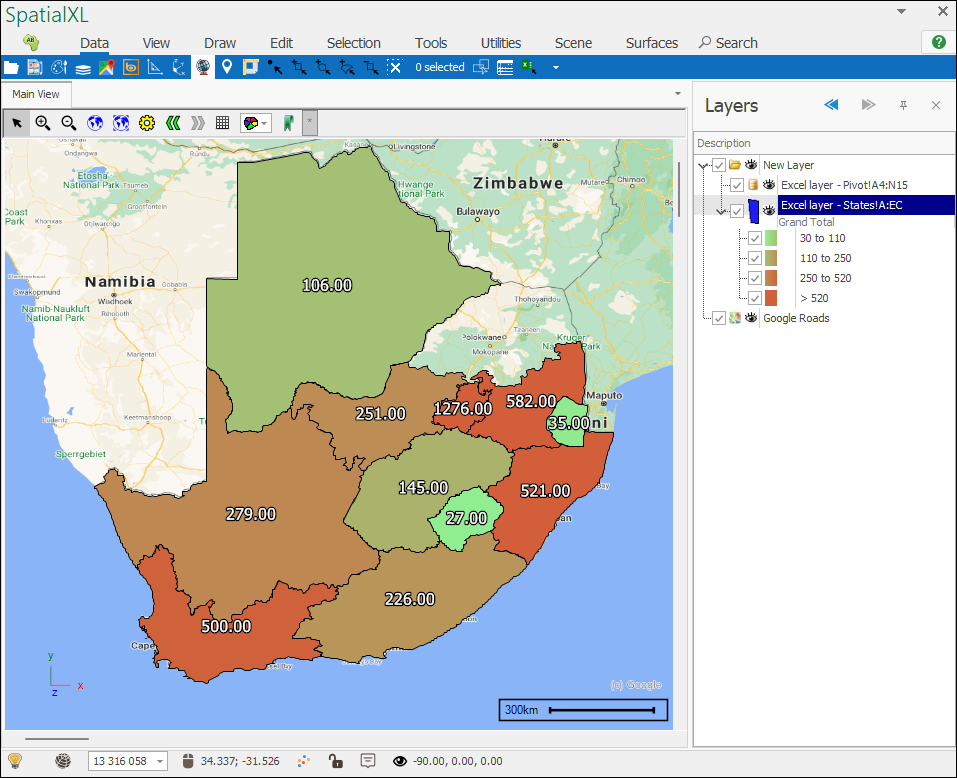
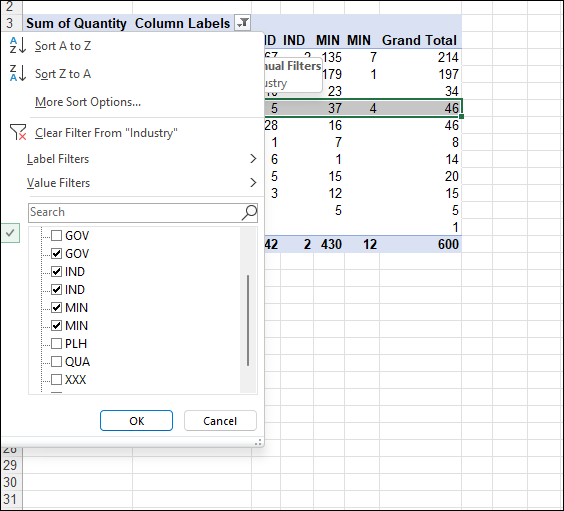
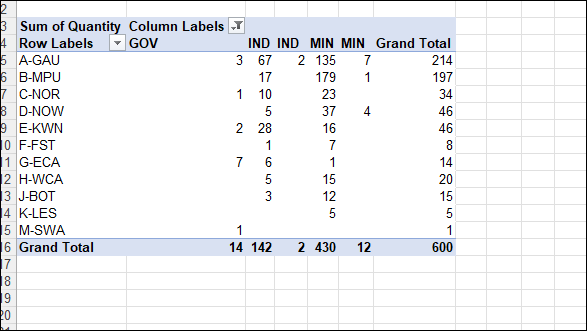
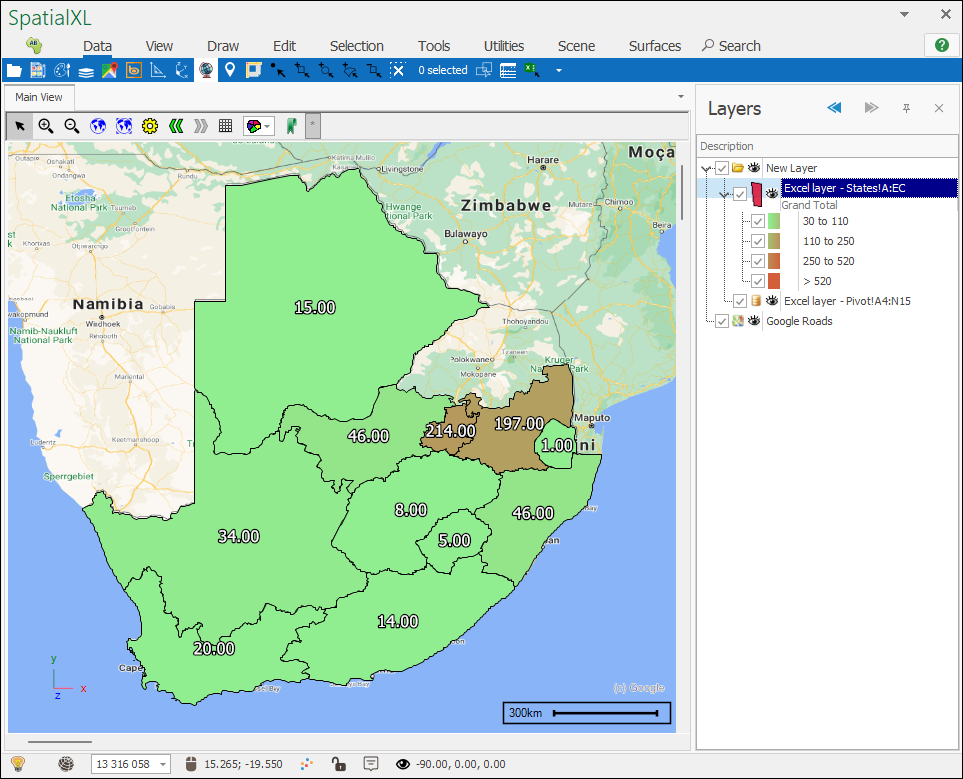
❖Now, when I apply filters on my Pivot the values will reflect according on the map: