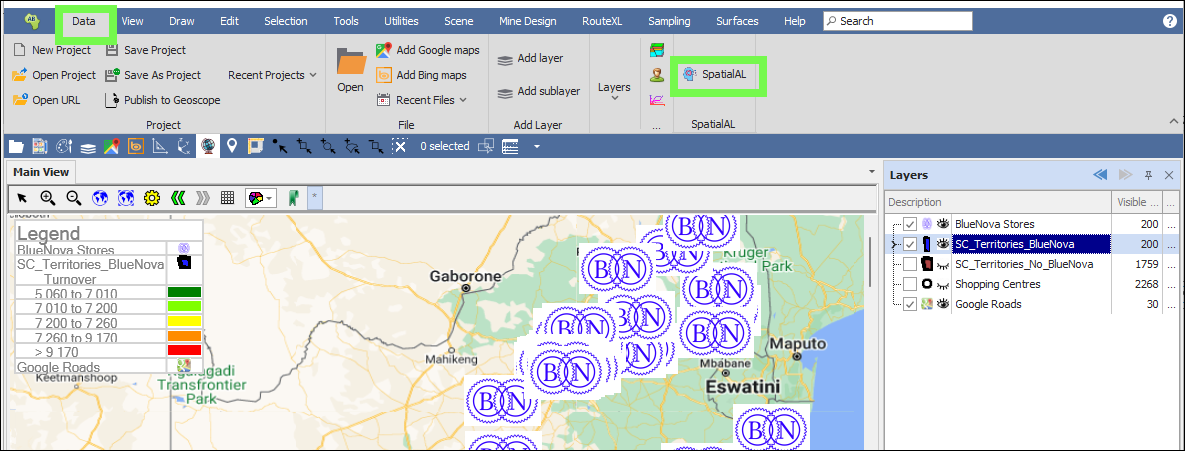
❖Once you have installed SpatialAL it will appear as an item in the Data tab of your spatial product
❖The first step in machine learning is ‘training’ the model; this means feeding it with data so that it can learn and pick up patterns from it and then choose the best prediction model for your data. The tool runs through a library of many, many different models and tries to find the best fit.
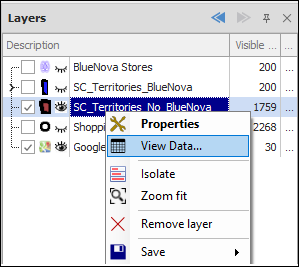
❖Before opening the tool, you will have the layer highlighted in your layer control that you want to apply it to; this will be the original set of data you will use to ‘train’ the model:
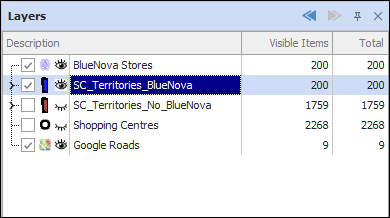
(SC_Territories_BlueNova stands for Shopping Centre Territories of current Blue Nova stores)
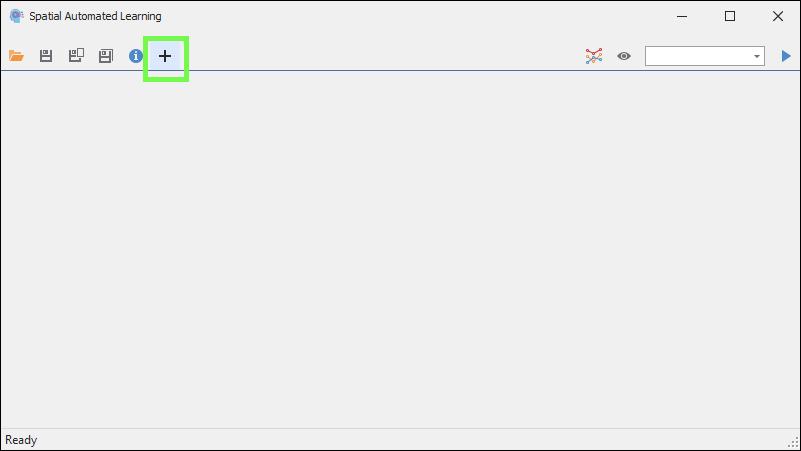
❖Then click on the tool to open it; this brings up the SpatialAL window. Click the plus sign to create a new model:
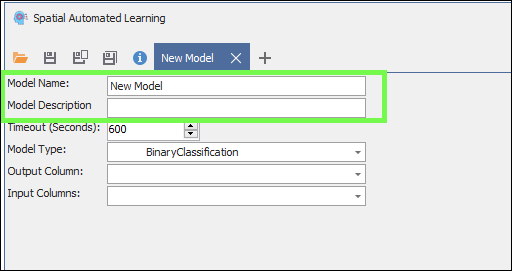
❖Give the model a name and optional description:
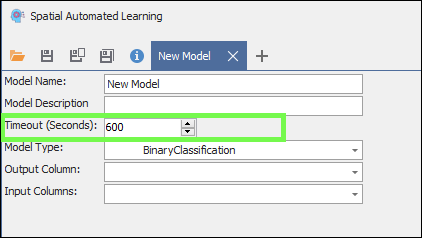
❖The Timeout(Seconds) is how long to run the model training before it times out; the tool will continue to search through and test all possible models to find the best fit for your data during this timeout period:
❖Then, the Model Type, is the type of analysis you want to run with the machine learning:
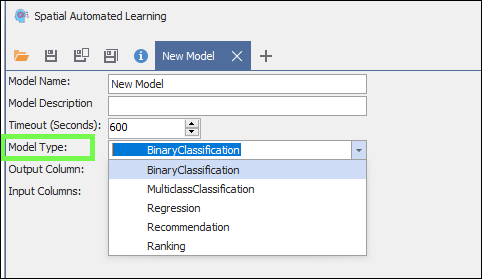
There are 5 main types available in the product, these are explained below:
BinaryClassification: Get a yes or no answer; is the subject one thing or another.
MulticlassClassification: Classify the subject into more than two classes such as: Low, Medium, High.
Regression: Regression is defined as a statistical method that helps us to analyse and understand the relationship between two or more variables of interest. The process that is adapted to perform regression analysis helps to understand which factors are important, which factors can be ignored, and how they are influencing each other.
In regression, we normally have one dependent variable and one or more independent variables. Here we try to “regress” the value of the dependent variable “Y” with the help of the independent variables.
In other words, we are trying to understand, how the value of ‘Y’ changes with reference to change in ‘X’.
For the regression analysis to be a successful method, we understand the following terms:
Dependent Variable: This is the variable that we are trying to understand or forecast.
Independent Variable: These are factors that influence the analysis or target variable and provide us with information regarding the relationship of the variables with the target variable.
This is the most common method of analysis or Model Type we use, and we use it to predict things like turnover, profit etc.
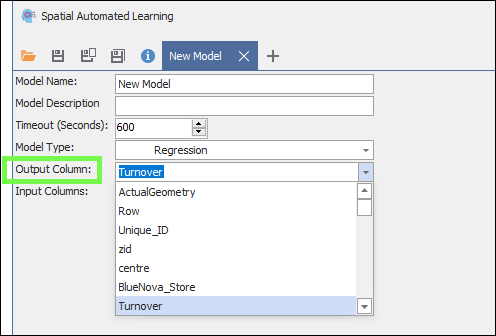
❖Then Output Column is the column in your data that you are trying to predict as the output and which will be used in training the model, for example Turnover:
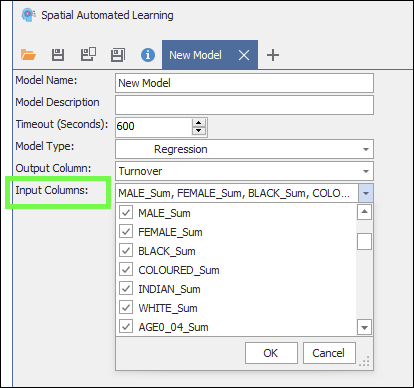
❖Then, Input Columns are the columns in your data that you will feed to the machine learning algorithm so that it can learn and pick up patterns to predict the output; you will normally try to use as much input data as possible ; the more data it has, the better it “learns”; if it finds any data irrelevant, meaning it can’t pick up any pattern with it, then it will leave it out of the process of building the model; so you can’t give it too much data:
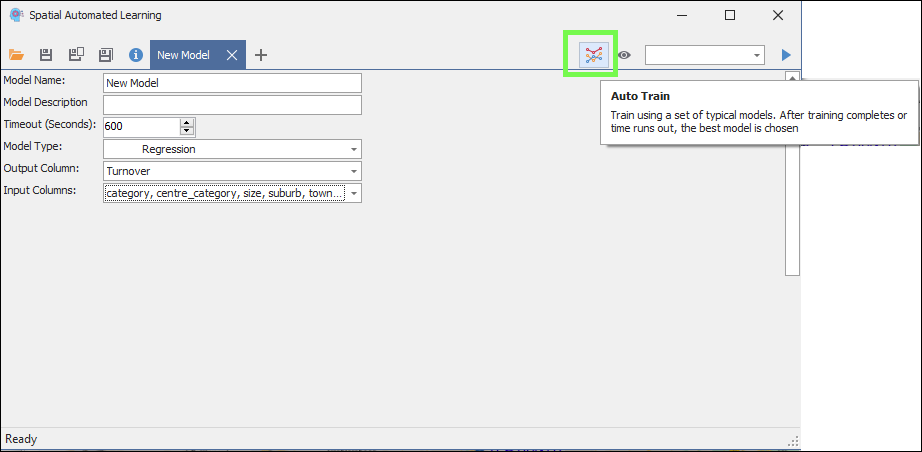
❖Then, click the Auto Train button to start training the model, it will run through your data and go through various models to find the best fit for your data:
You will see the various algorithms it tests by the progress bar below. The training will end at the timeout you set or can be stopped before that by clicking the Cancel button:
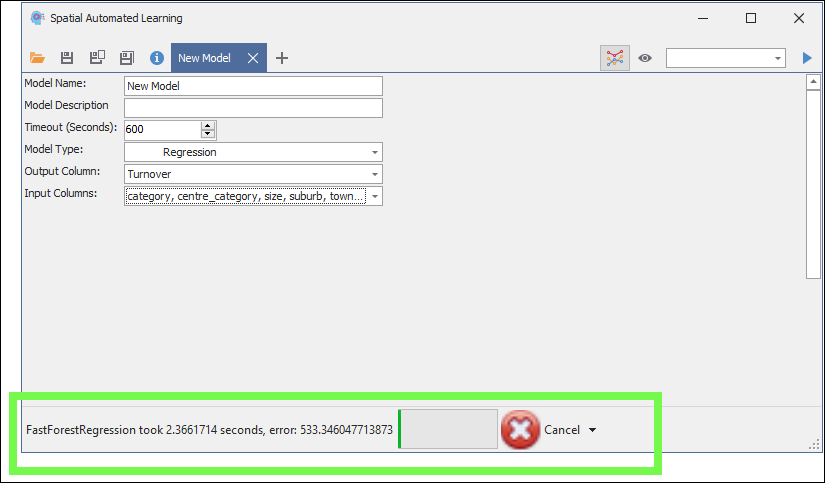
No matter when it stops or when you stop it, it will choose the best model it was able to find in the time period of the training.
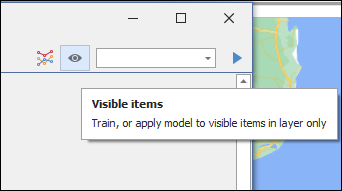
To only apply the training to visible items, meaning items not filtered out on the map but showing, then click the eye icon so that it’s greyed before running the training:
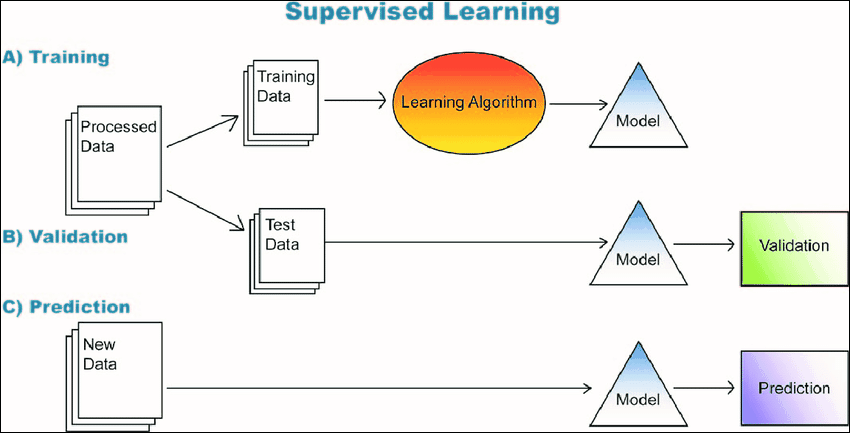
❖When you have done training, you will now have a model which you can apply to predict whatever output you are trying to predict. The way you would go about it normally is to train your model with 80% of your original data. Then afterwards apply the model now gotten to the 20% remaining portion of your original data and see how well it is able to predict that output. If there is only a small variance between the actual output column and the predicted output column, then you know your model is working well and has been validated. You could then go ahead and apply this model to other new data to predict the output.
❖To apply a model, you would first make sure you have the layer with the data that you want to apply it to highlighted in the layer control; then you would select the column, from the dropdown list on the top right, where the predicted output will be populated in the data (you would normally add a blank column where the values can be populated in the data grid):
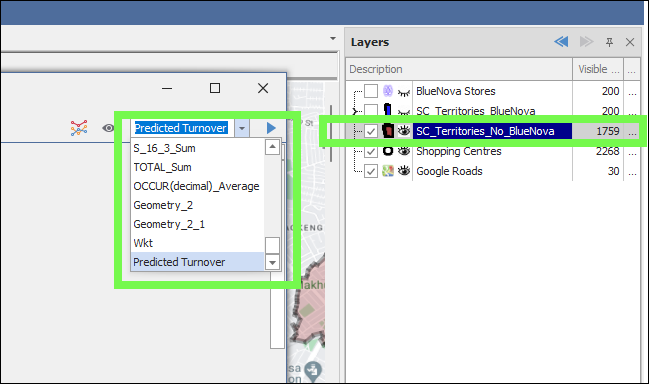
Important Note: The new data you are applying the model to must have the same column field names as the original data used to train the model so that it can recognize what they are.
❖Then you would click the Apply button and the model will run on this data:
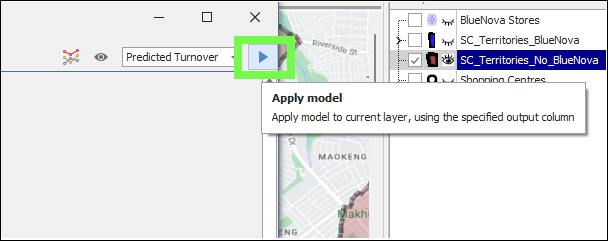
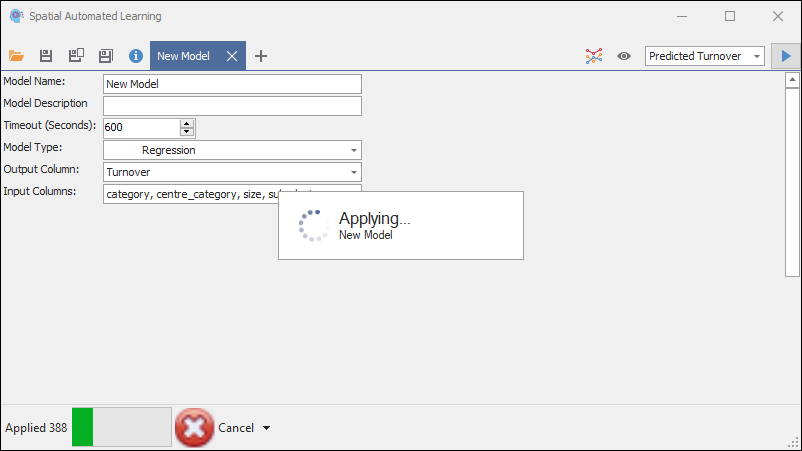
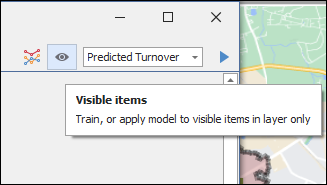
To apply the model to visible items only in the layer, meaning items showing on the map and not filtered out, then click on the eye icon so that it is greyed before applying the model:
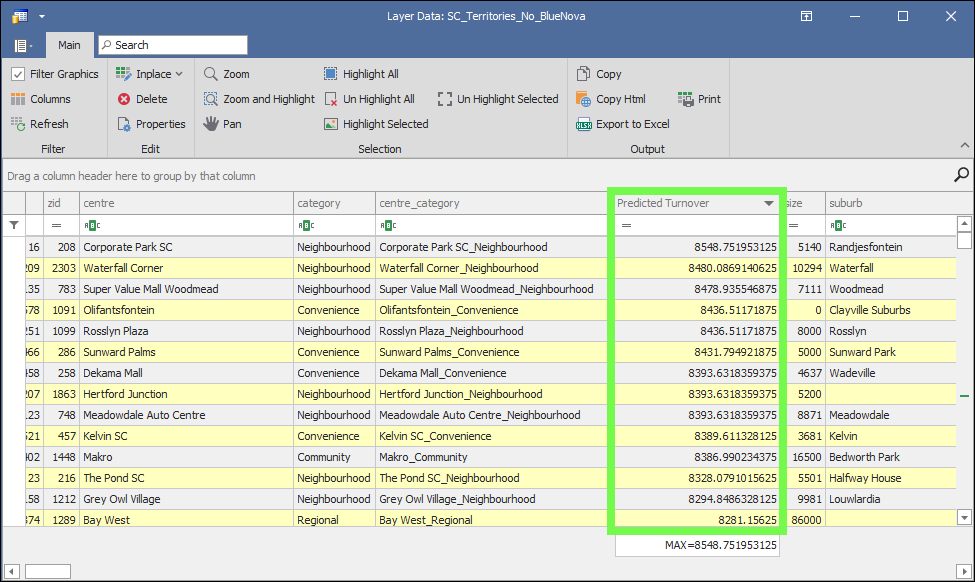
The results will be populated in the output column of the layer that you specified in the dropdown list:
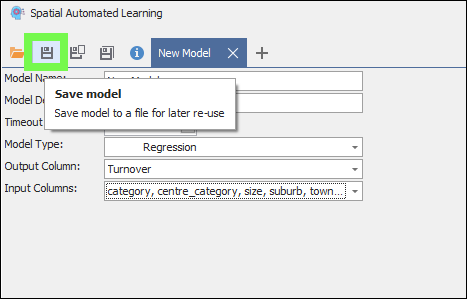
❖The model can be saved out so that you can load it and use it again at another date:
❖The following graphic illustrates the process of regression modelling. Regression modelling is termed ‘supervised learning’ as it uses data that has been ‘labelled’ meaning where the output values already exist, such as existing annual turnover values, in order to train the model. These ‘labels’ supervise the training and lets the machine know what the output looks like as opposed to letting the machine figure it out on its own (unsupervised machine learning):
