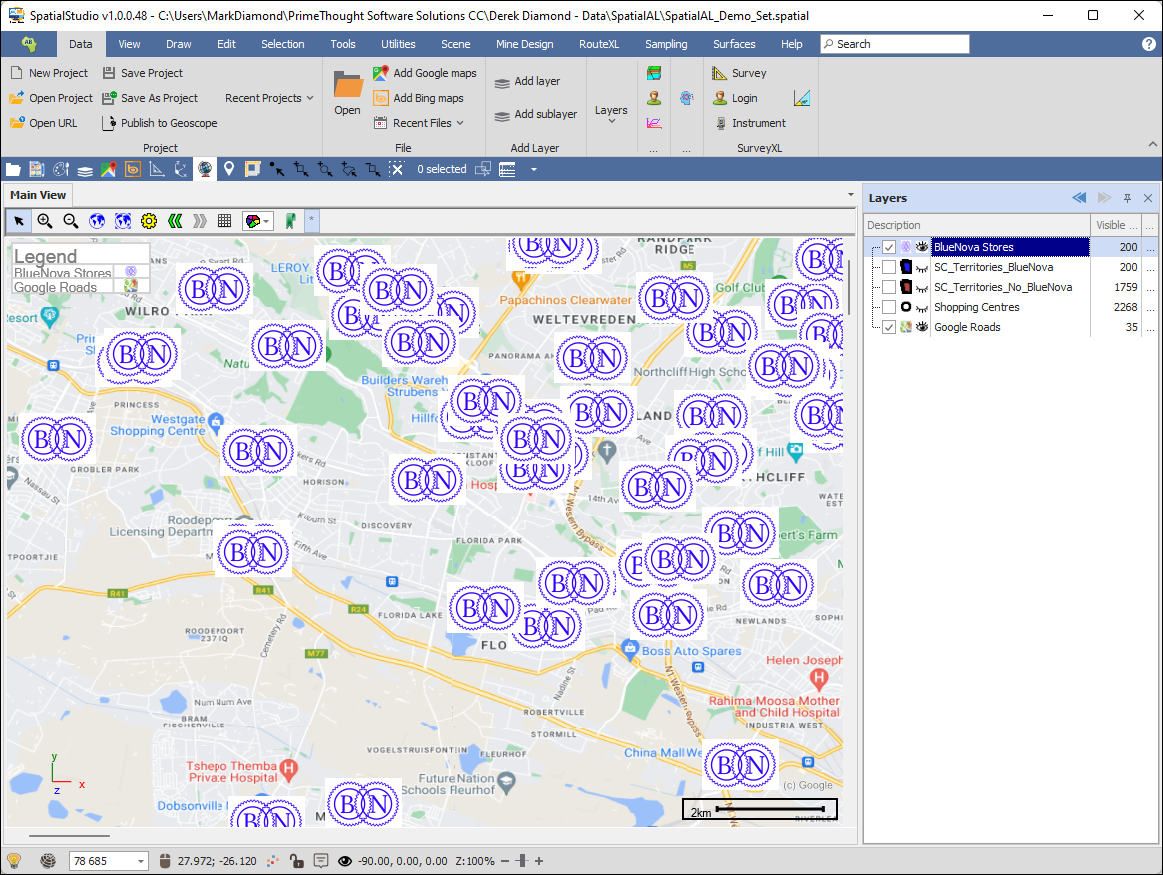
❖In this example I have my Blue Nova stores plotted on the map, 200 of them in total. I have various data about them including annual turnover values for each store. Using SpatialAL I would like to be able to predict turnover values for potential new store locations. So, this is the process I follow:
Step 1:
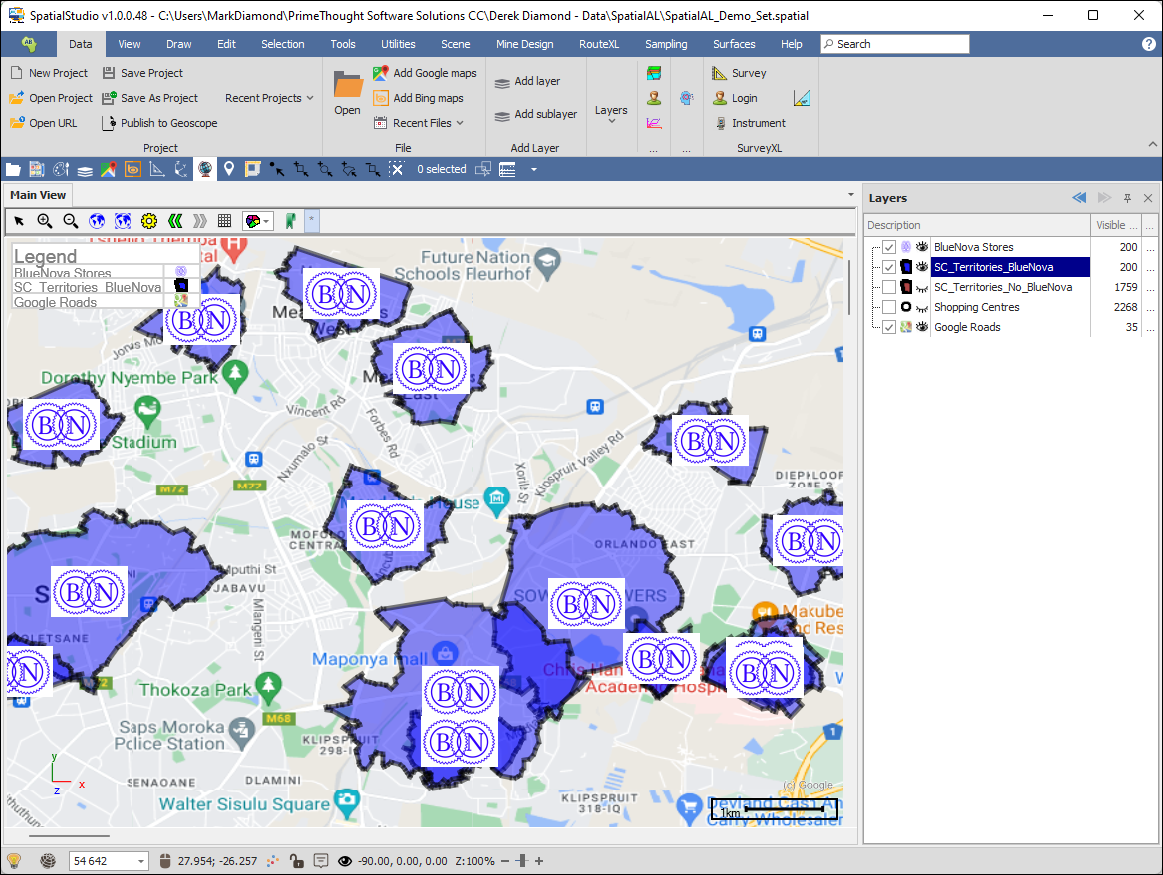
Determine the territories for each existing Blue Nova store. I created drive time polygons of certain amounts for each store based on the type of shopping centre the store is located in such as Regional, Super Regional or Neighbourhood:
Step 2:
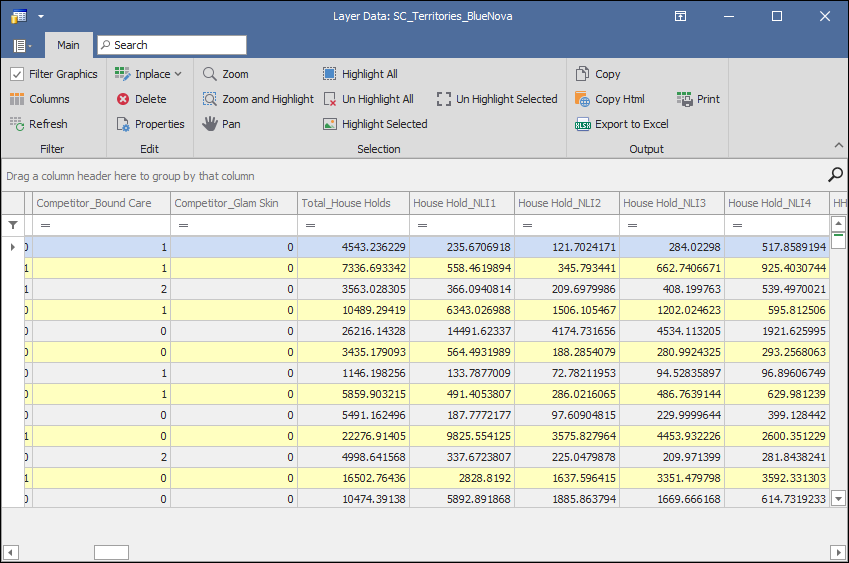
Aggregate all data possible into these territories such as the number of households in each territory, the number of competitor stores in the territory, the race breakdowns, age breakdowns, day and night working population, new developments in the area etc. etc.
Step 3:
Take this Shopping Centre Territories layer for the existing Blue Nova stores which has the original data and all the aggregated demographic etc. data and use this to train the model in SpatialAL.
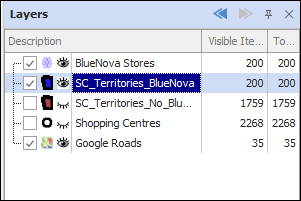
To do this I make sure to first have this layer selected in the layer control, then I bring up the tool:
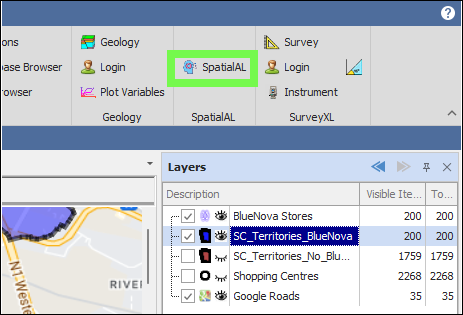
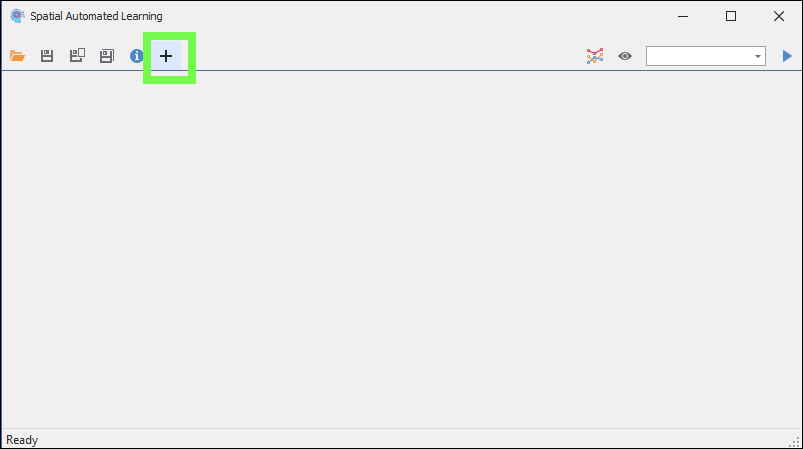
I click the plus icon to create a new model:
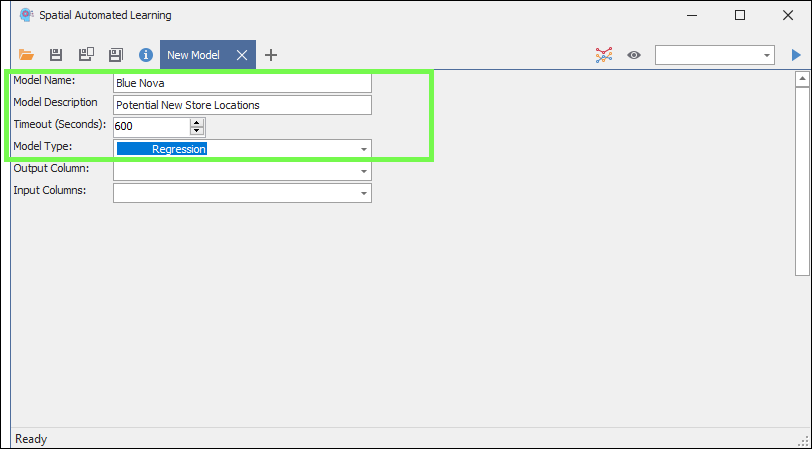
I then give it a name and description and choose a regression model type:
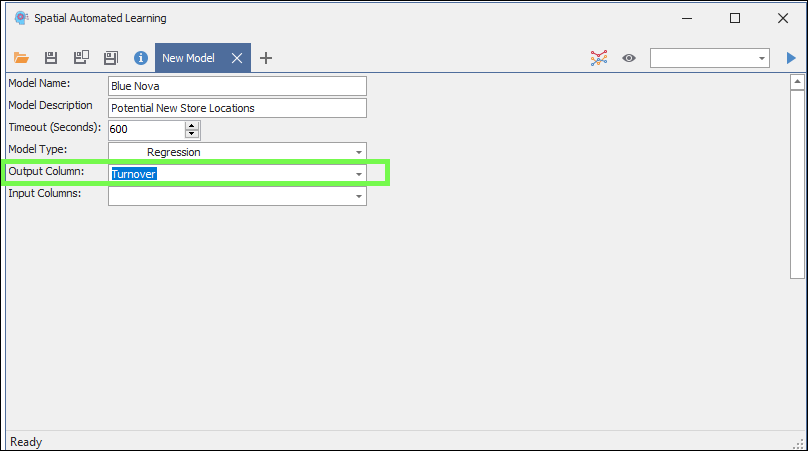
The Output Column in this case will be the Turnover column in my data; this is the column with the values I would like to predict and get as an output when I apply this model later to new data:
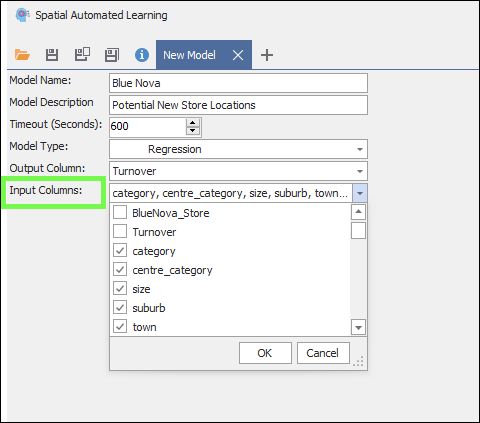
Finally, the Input Columns will be all the data concerning the store and all the data I aggregated into the territories; this will all be used to pick up patterns in the data when training so as to be able to choose a model that will predict turnover (certain columns like the store name and ID will not be relevant in training the model so these will be ticked off; also of course the Turnover column will not be ticked on here as it is selected as the Output Column already):
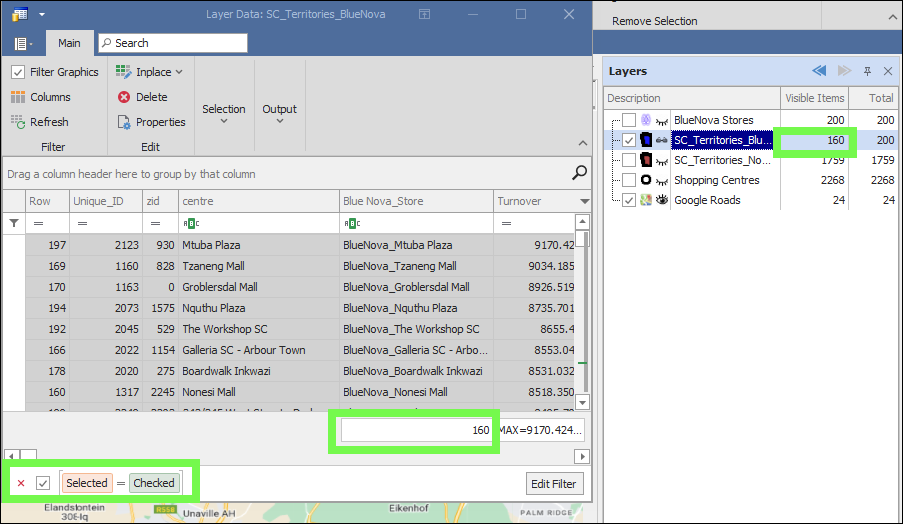
I am now ready to train the model. However, I am only going to use 80% of my data to train the model with. Then when it has determined the model, I will apply it to the remaining 20% to see if it is predicting accurately.
Therefore, I have filtered my current store territories so that only 80% of them are visible:
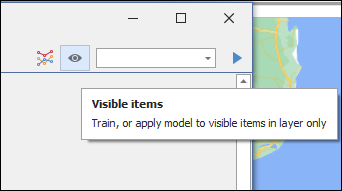
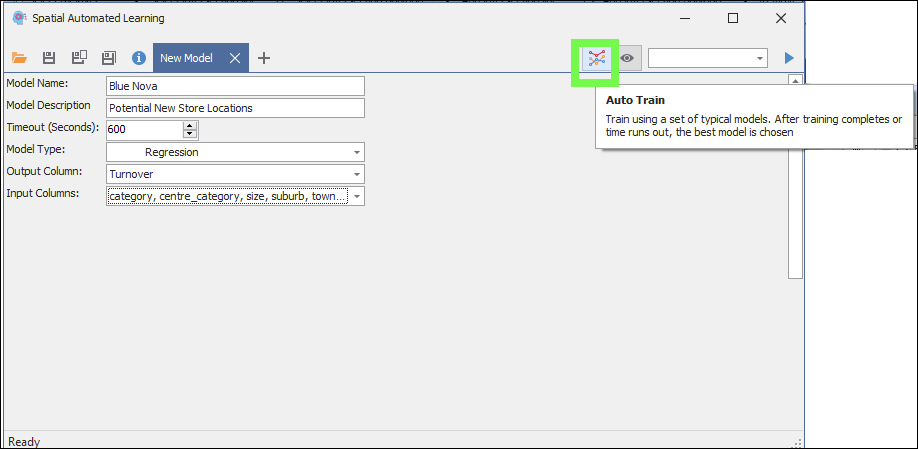
Then I will click on the eye icon in the top right so that it is greyed, this means the training will only be applied on the visible items:
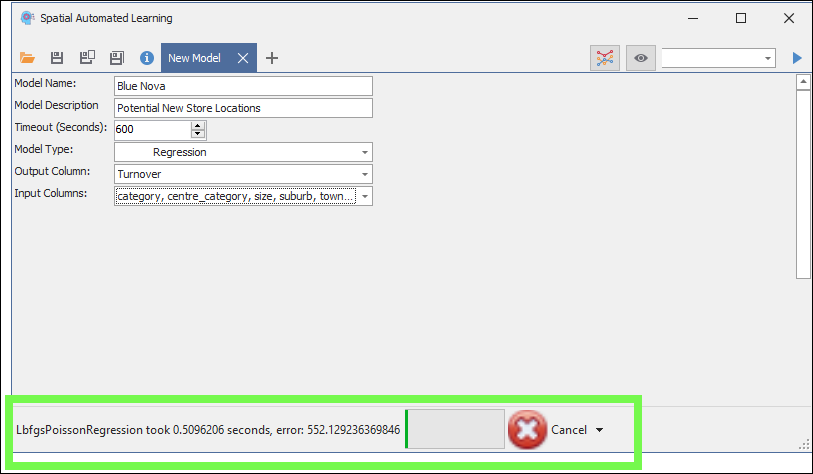
I then click the Auto Train button and the training runs:

Step 4:
My training is done, and my model is ready. To now validate my model and test whether it will predict turnover values correctly I will apply this model to the remaining 20 % of my data. I will first change the filter of my data so that only the remaining previously filtered out 20% is now showing:
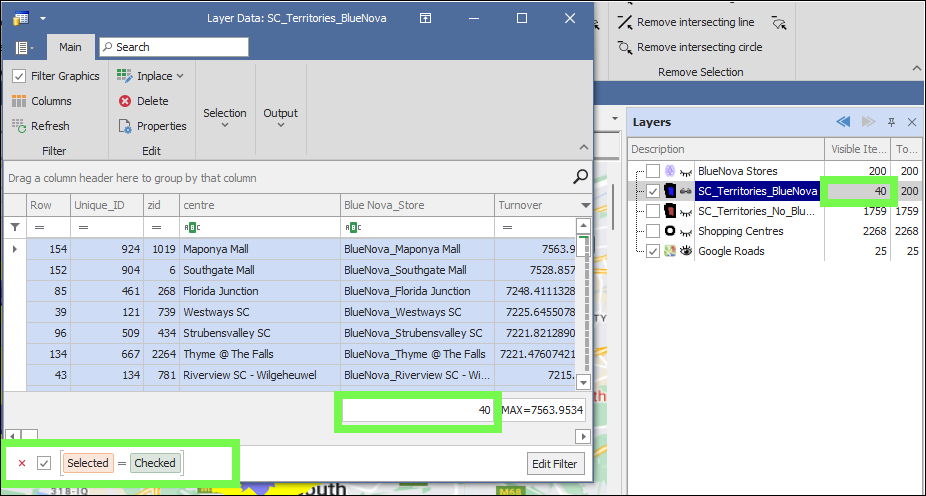
Then, with my eye icon still greyed out so that the model is applied only to visible items, I will then apply the model to this remaining 20% and see how well it predicts it.
Now, before I do this, I will add two new columns in the data grid, one where the predicted values can be populated and one where a variance between the predicted and actual is calculated:
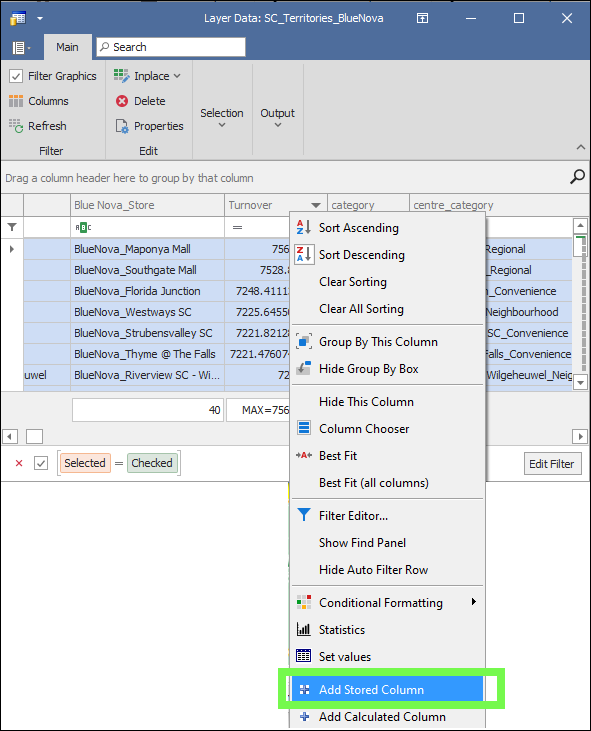
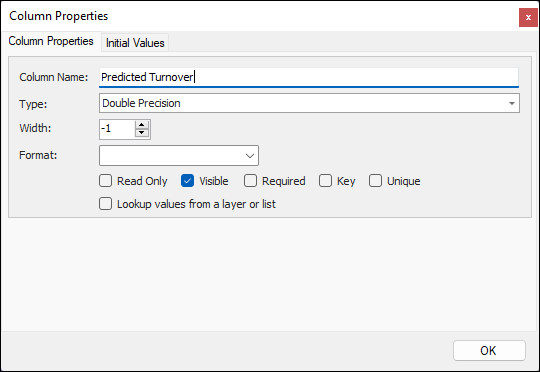
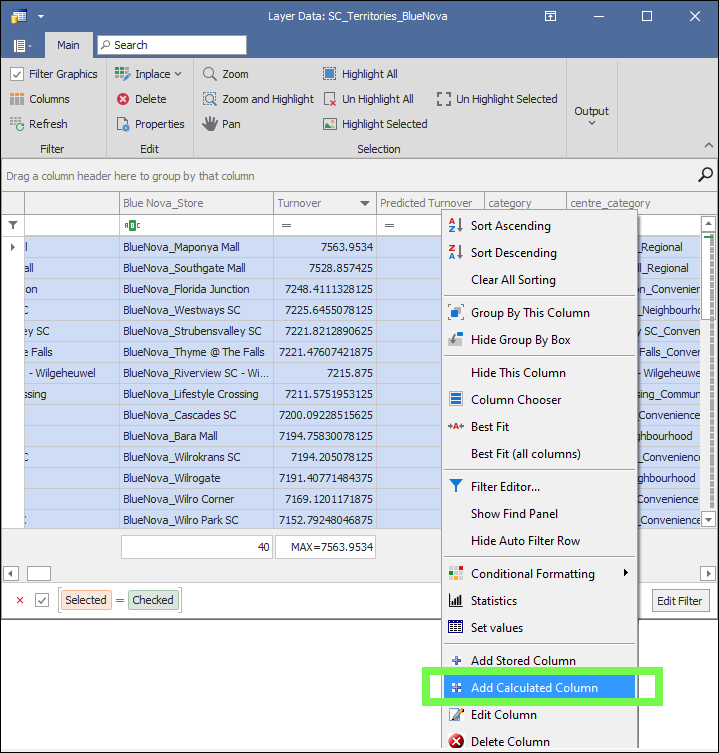
Then I will add another column which will be a calculated column this time for the variance:
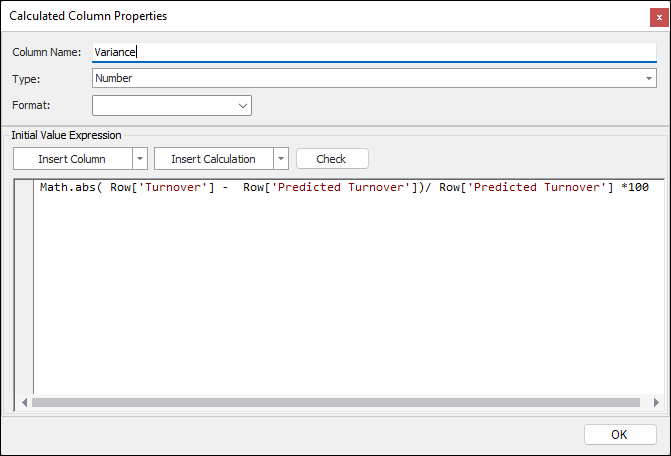
In the Calculated column is a calculation specified for the variance between the actual turnover and predicted turnover:
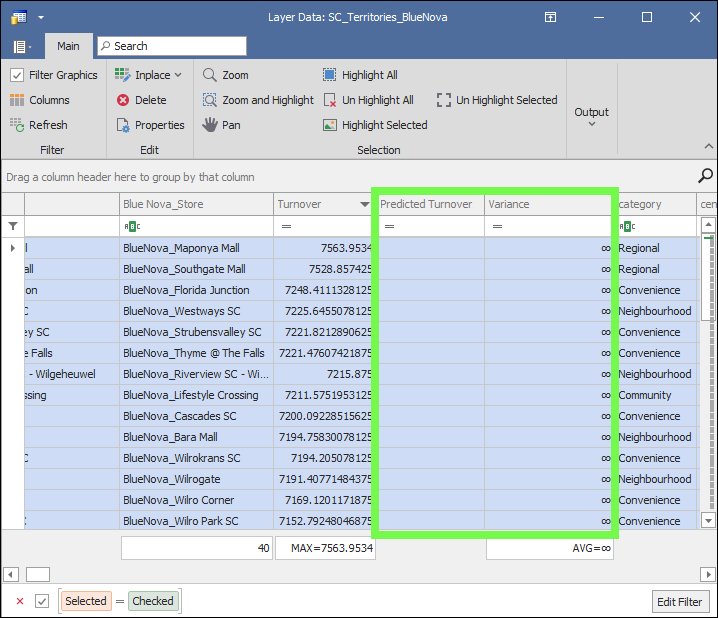
I can now choose the output column where the predicted results will be populated, in this case it is the Predicted Turnover column, then I will apply the model by clicking the Apply button:
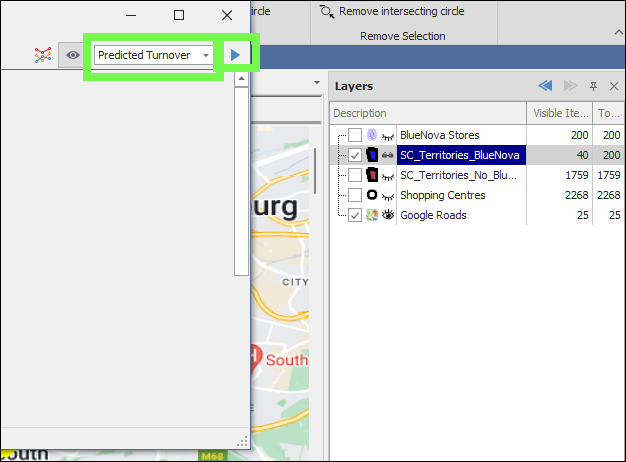
The model will run, and the predicted results will then be populated in the data grid along with the variance:
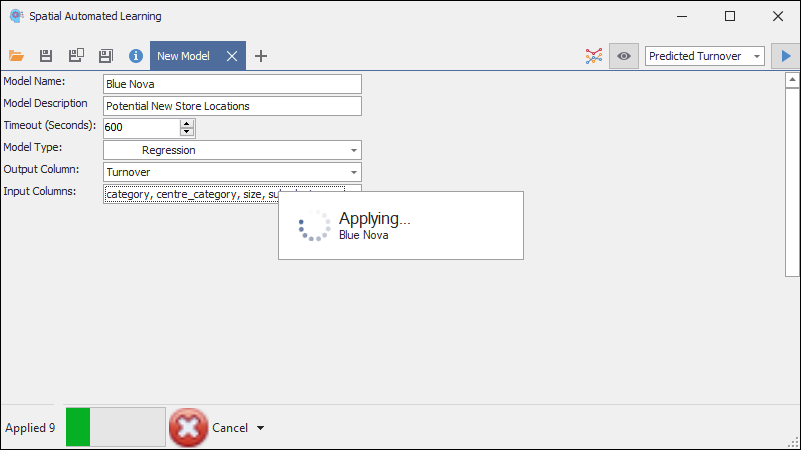

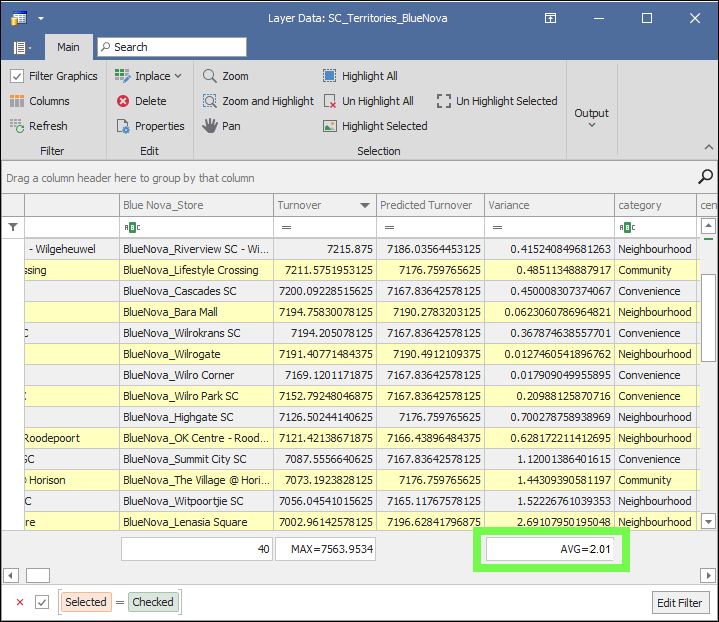
We can see that it predicted the results quite well with a variance of only 2.01 percent, this means our model is now validated and works.
Step 5:
Create territories for all shopping centres in the country where a Blue Nova store doesn’t exist and aggregate all possible demographics etc. data into that territory just like we did for the existing stores territories. These territories were created and sized based on the type of shopping centre such as Regional, Super Regional or Neighbourhood.
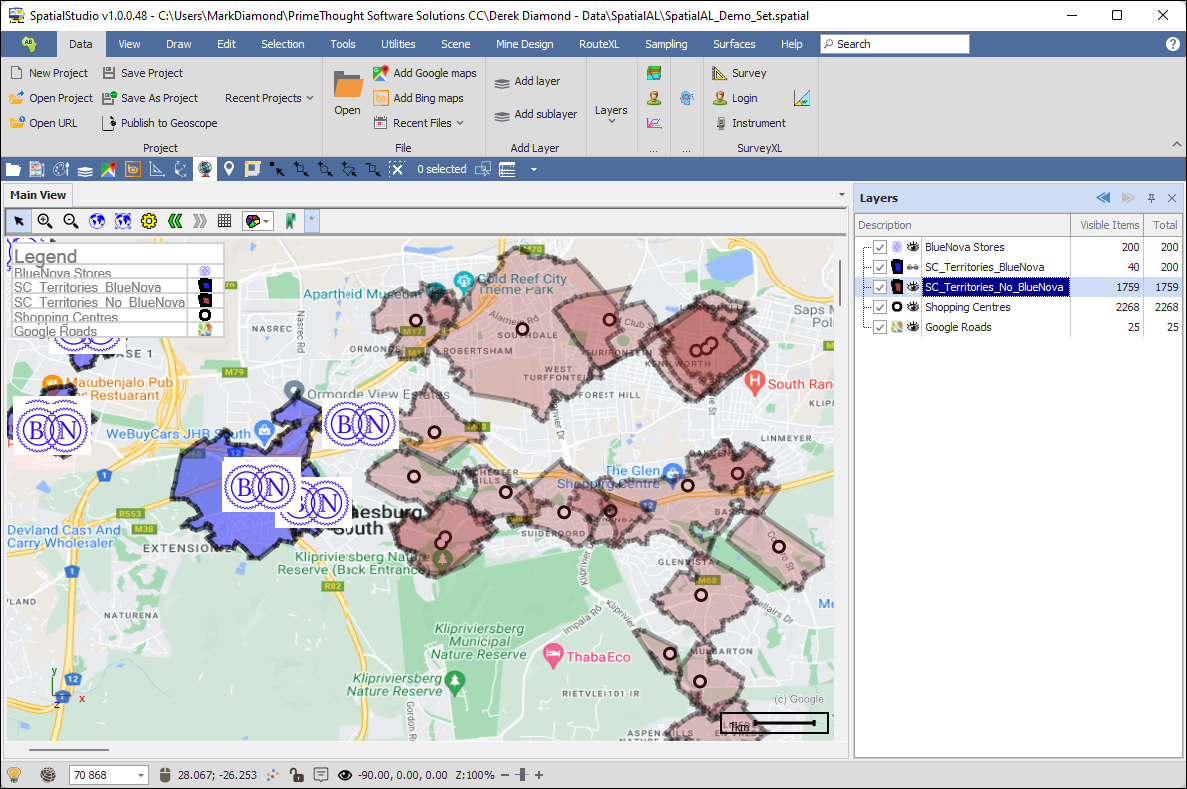
Step 6:
Apply our model to these new territories to predict what their turnover values would be. First, we make sure to have the shopping centre territories with no Blue Nova highlighted in the layer control:
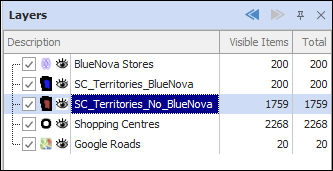
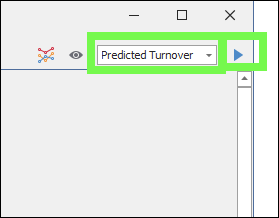
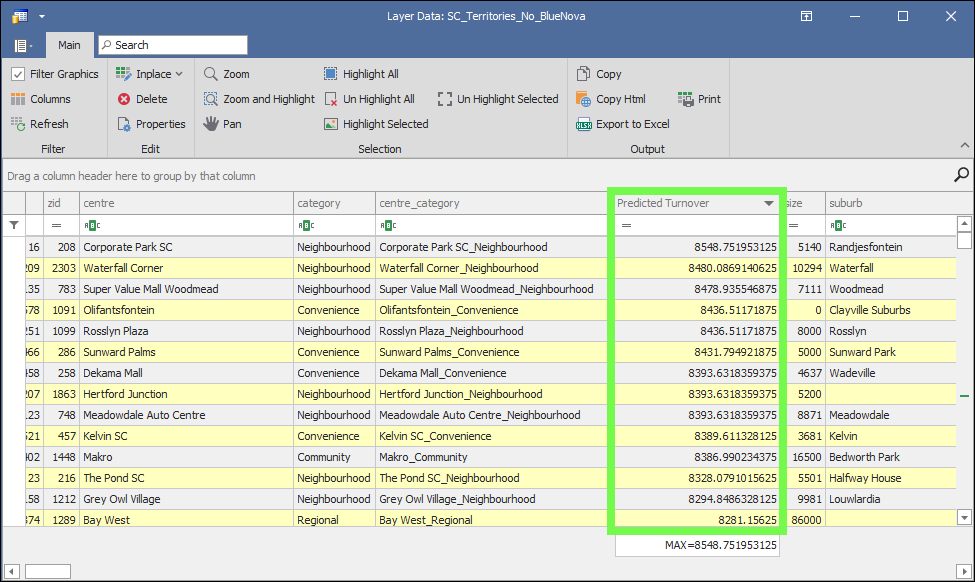
Then we select the output column where the predicted values will be populated, in this case called Predicted Turnover (this is an empty column we added in the layer data grid). Then we click the Apply button to run the model on these new territories.
Important Note: The new data you are applying the model to must have the same column field names as the original data used to train the model so that it can recognize what they are.
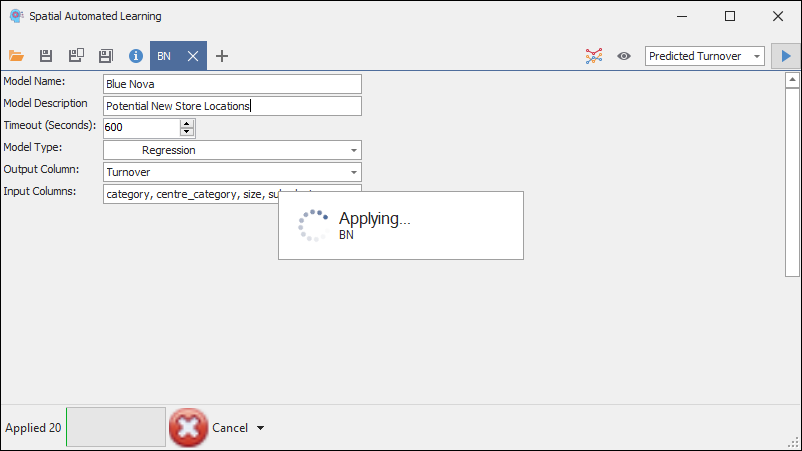

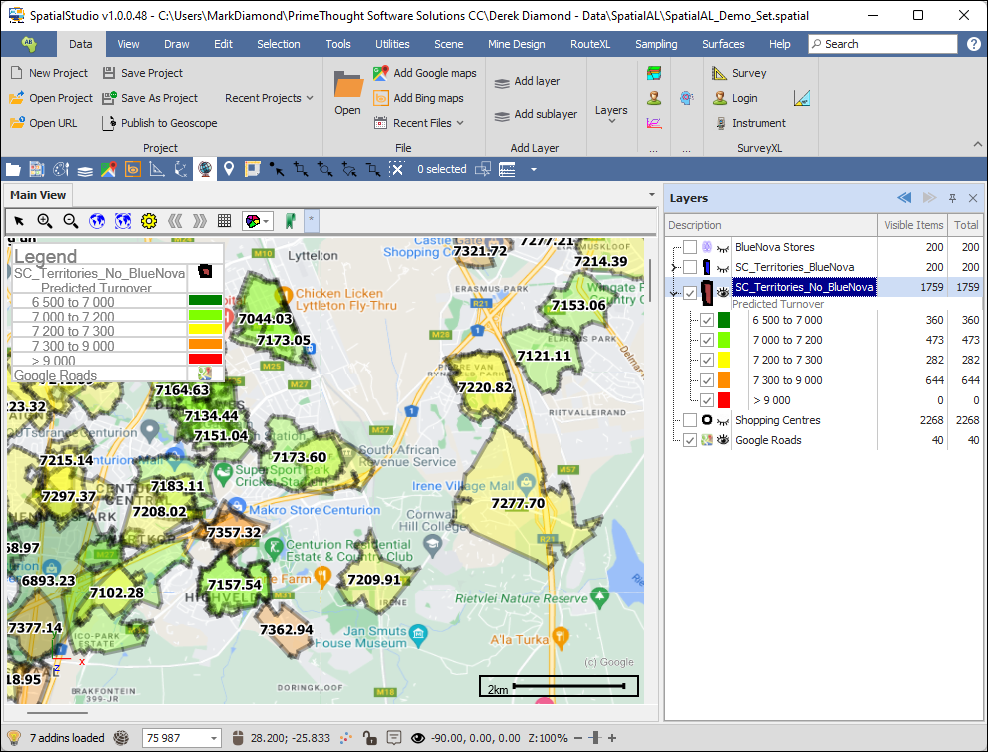
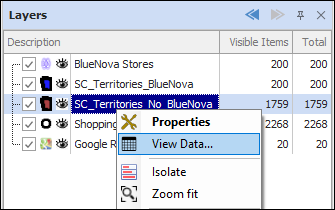
❖We can now view our results in the layer data grid to see the predicted turnover values:
❖Then we can apply a colour theme on these predicted values as well as put on a text label of the predicted turnovers so that we can analyse these potential new territories on the map and make a decision on where would be the most profitable place to put a new Blue Nova store:
