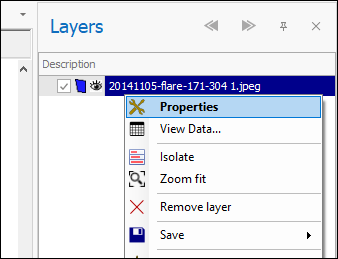
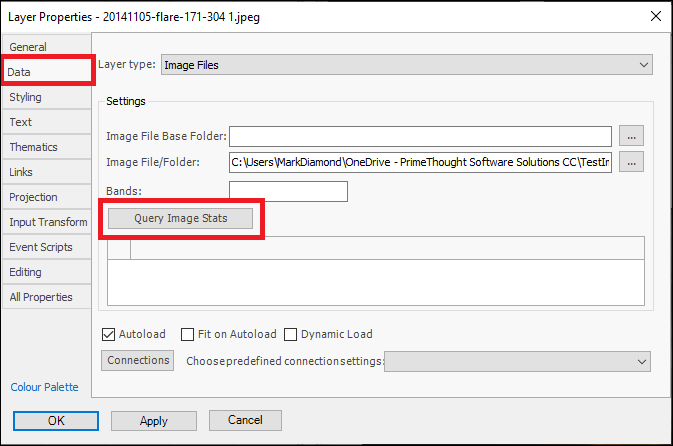
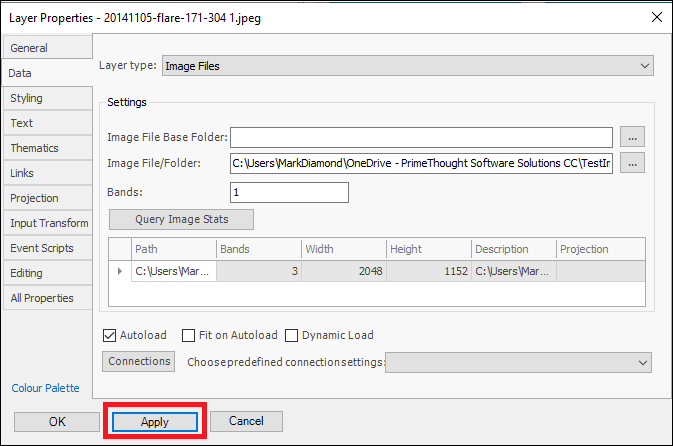
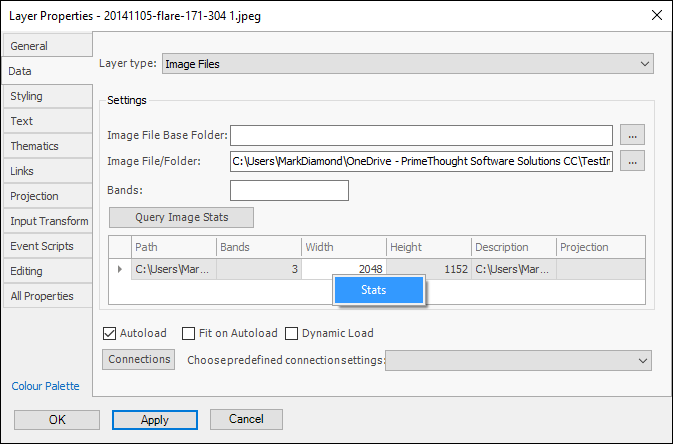
❖When an image has been brought in you can also query some stats relating to it that will give you the number of colour bands associated with the image, the height, width etc. This is done in the Data tab of the Layer Properties dialogue:
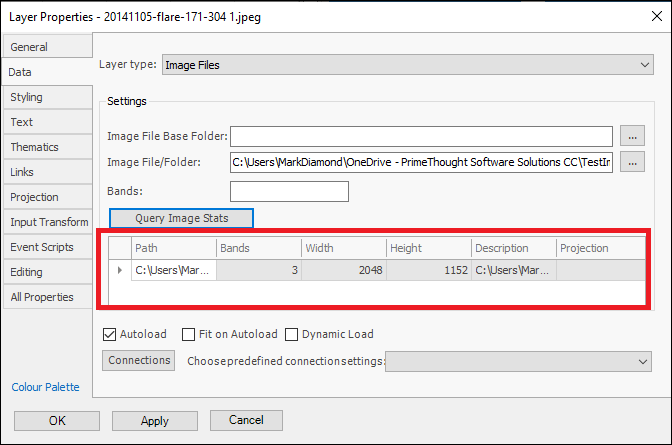
This image has 3 bands as we can see (Red, Green, Blue). An image can have more than 3 bands and often when it has 4 bands, the 4th band is a transparency, this type of band is referred to as ‘Alpha’.
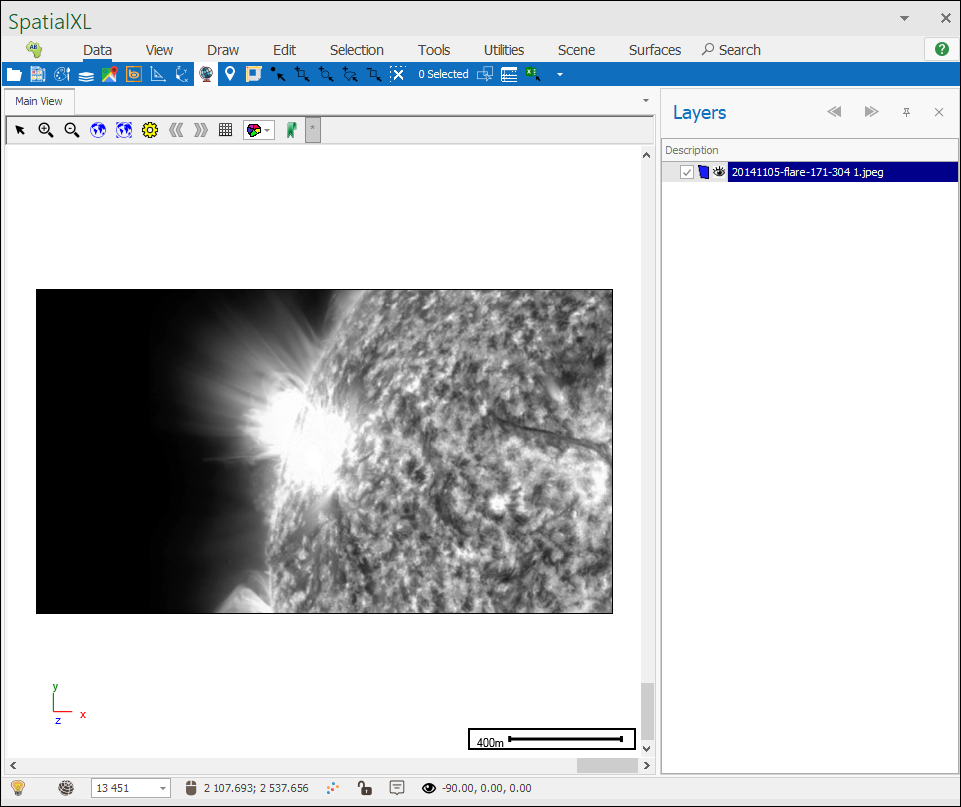
We can choose which bands to display, for example I will choose to only show band 1, by entering in 1 by the Bands field, this will give me a monochrome image (if this field is left blank it will just assume the default display of bands):
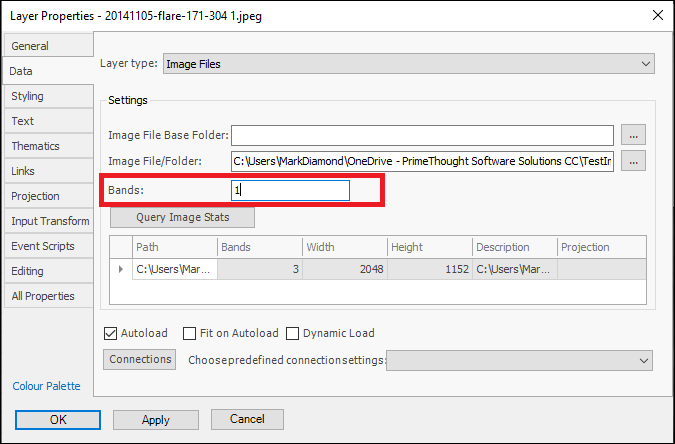
I can then press Apply to see what this looks like on my image:
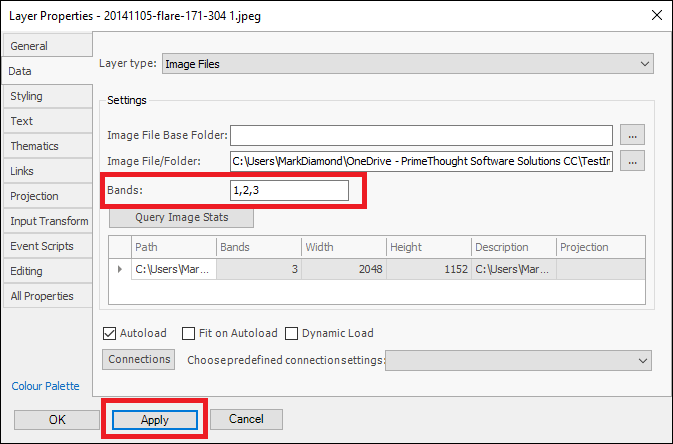
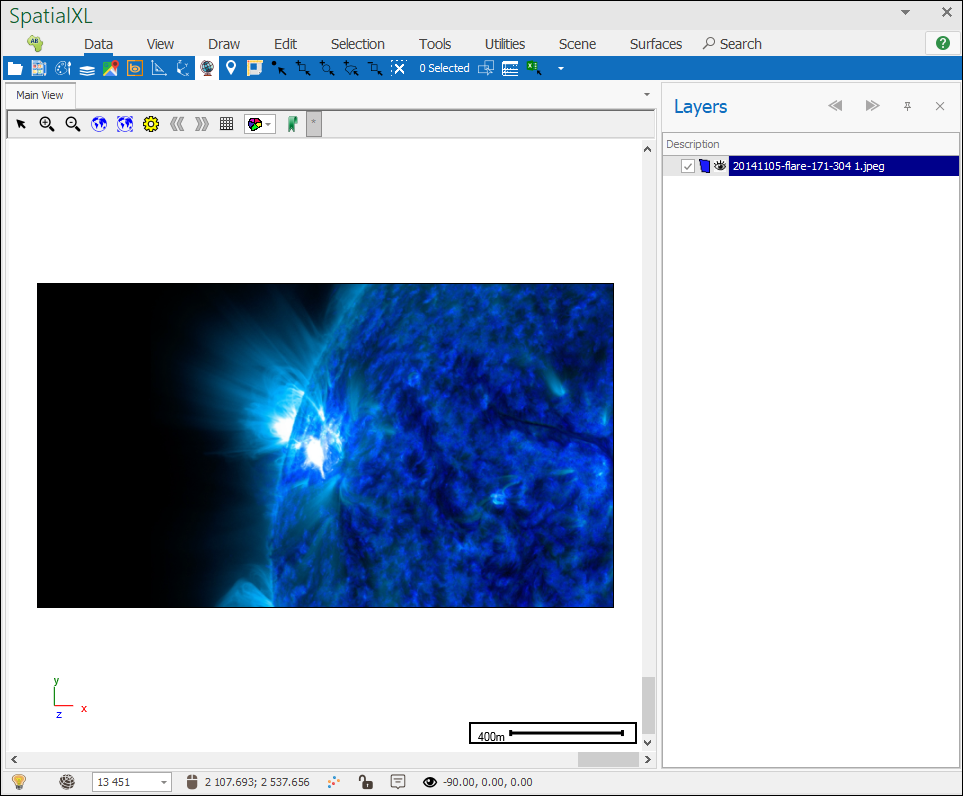
❖You can also choose the order of display of the bands, so for example I will put the ordering as 1,2,3 (the default display is 3,2,1), this will make my image a negative:
❖What you can also do is query some further stats about the image which will bring up a graph showing the range of the colour band values, to get this, right click on the row in the grid and click Stats:
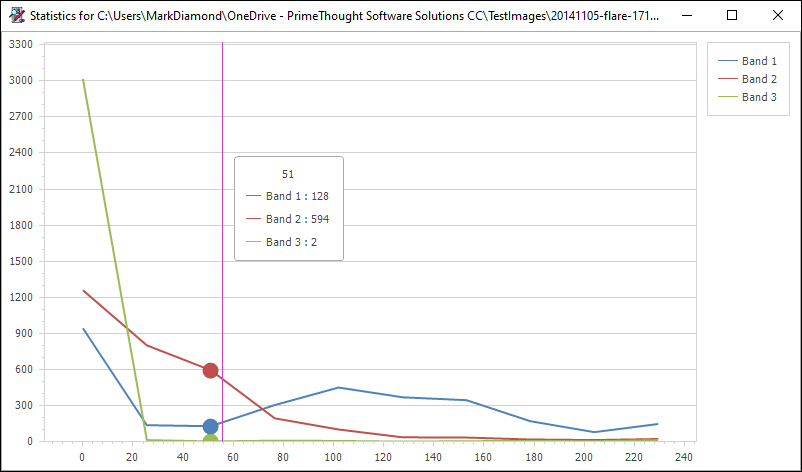
The horizontal scale is the colour value for each band, and this value is the amount of red, green and blue light in each band. The vertical scale is the number of pixels containing that colour value for each band.