Voronoi Diagram

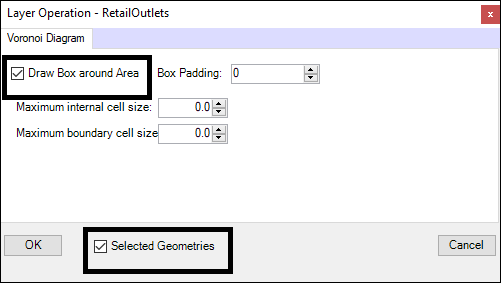
❖Another operation you can do on a layer is to create a Voronoi Diagram, which is a diagram that assigns a set of points in a plane into an equal number of cells, such that each point is inside a cell consisting of regions that are closer to it than any other point. I will do this on my Retail Outlets layer and only on a selection of points so I will have Selected Only ticked on. You would normally have Draw Box around Area ticked on as this is how the diagram is normally drawn:

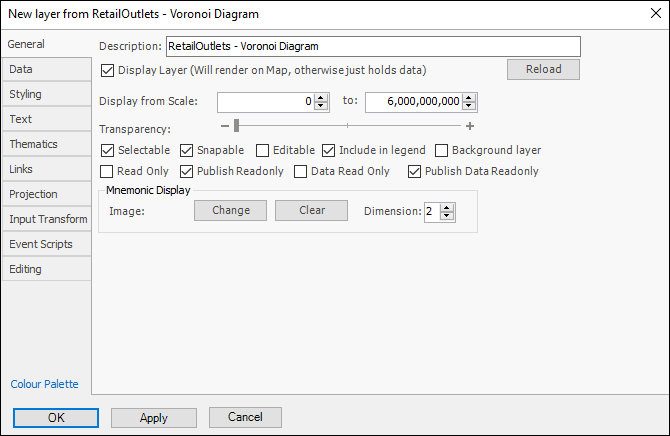
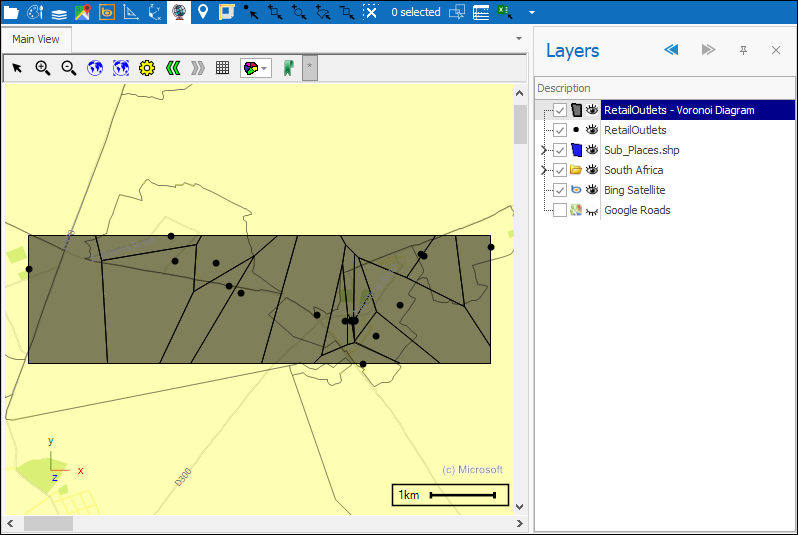
You can the click OK and you are prompted to set the properties of the new layer that will be created, then click OK again and your diagram is created:


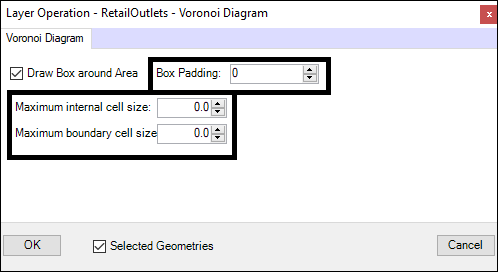
❖Maximum internal cell size and Maximum boundary cell size specify a limit on how big the inner and outer cells of the diagram can be. Box Padding will make a padding around the diagram of a certain distance that you specify:
