
StoryBoard
❖This is a feature in all our spatial products that allows you to easily present and demonstrate your data.
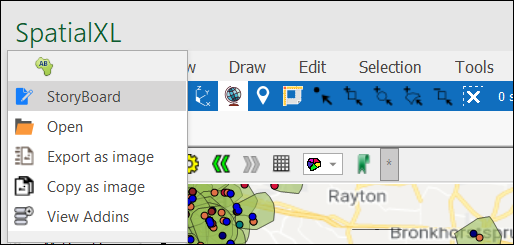
Viewing StoryBoard
❖Select StoryBoard by clicking on the Africa icon. You are only able to view StoryBoard and use it in the default Presentation mode if a StoryBoard was already set up. This is the case if you do not have StoryBoard stated in the license file. You won’t be able to design any StoryBoards of your own.
❖Look at About SpatialXL or the About dialog in your product where you will see if your license has Storyboard stated in the License Status. In this example I do not have Storyboard. I have Bi which allows me to use Dashboards.
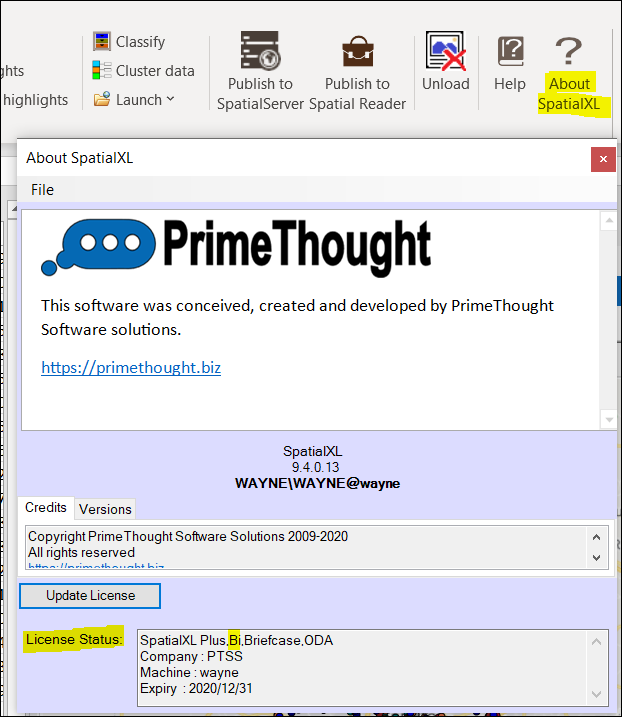
❖I will therefore show you how to use StoryBoard in this read-only mode.
❖You will see that there was a StoryBoard already set up in this example – New StoryBoard. You will also notice that the screen state changed moving your Excel Workbook around, Dashboard Viewer opening, and the SpatialXL scene and layers in a different state.
❖When opening StoryBoard from the menu, it will always open in the same state that you last left it when you were done using it.
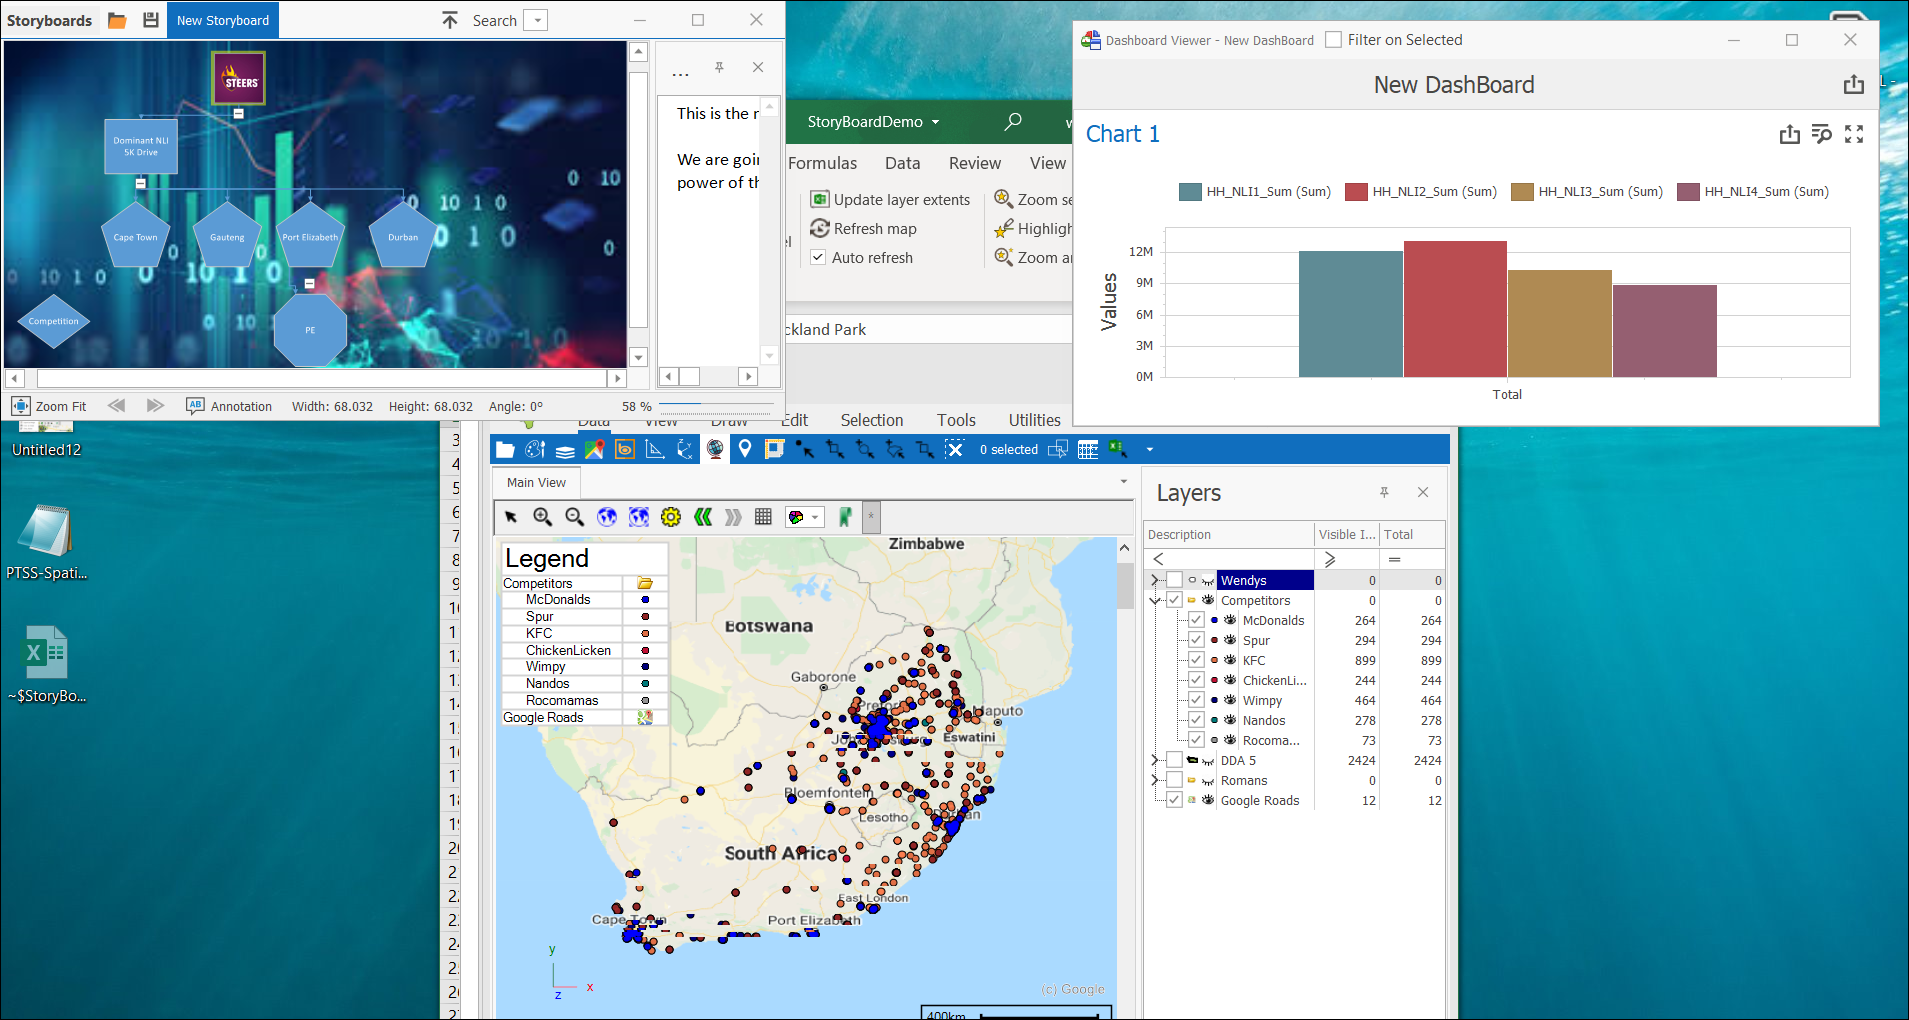
❖The different shapes in the StoryBoard’s window are called nodes. Currently, the STEERS node is selected indicated by the green border around the shape.
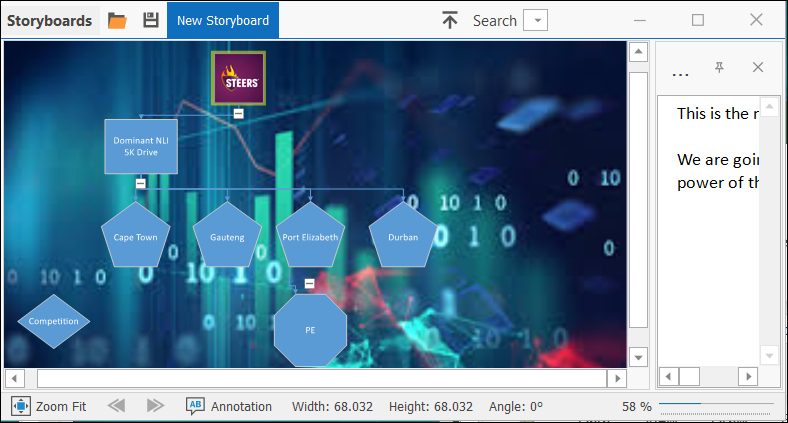
❖By selecting different nodes, you are then able to navigate through your StoryBoard when doing presentations and demonstrations. Each node has a different screen state etc set up as described above.
❖I selected the Cape Town node for another example.
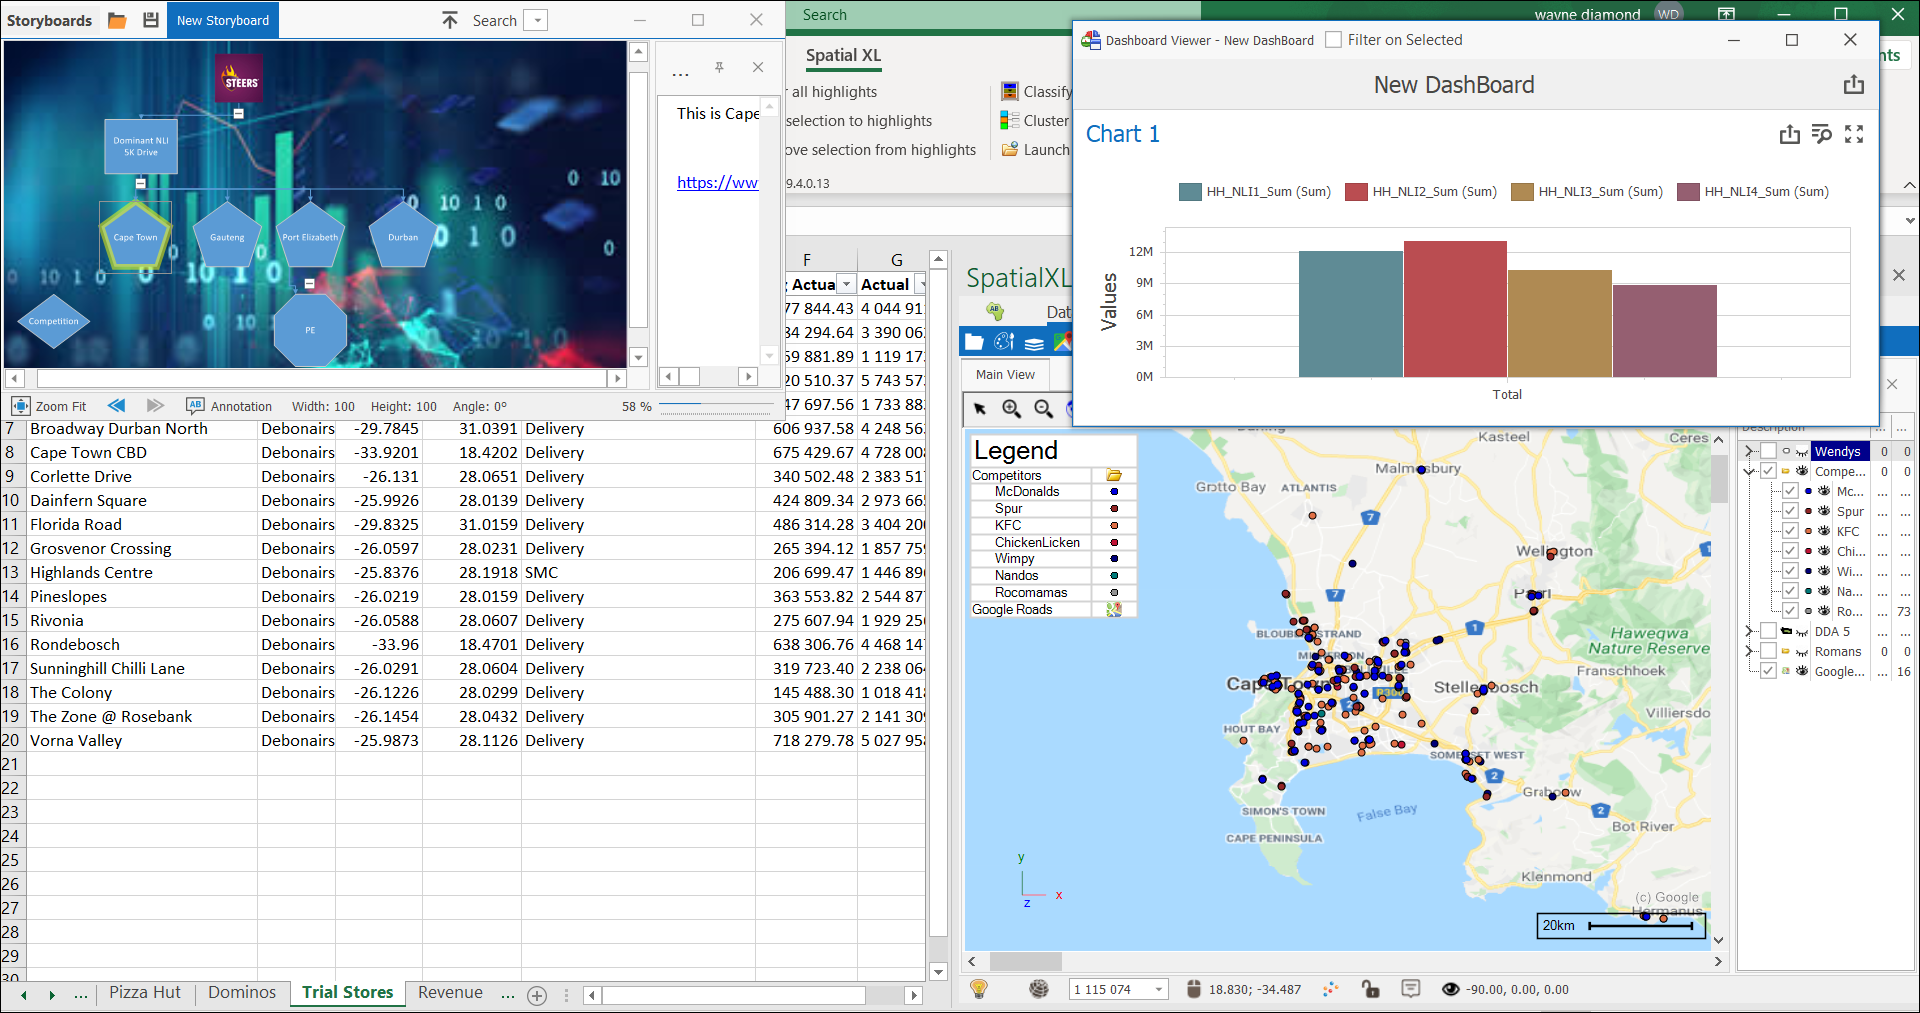
❖You can expand and collapse your StoryBoard nodes set up if you aren’t wanting to see all the nodes at once. Just click the – and + icons.
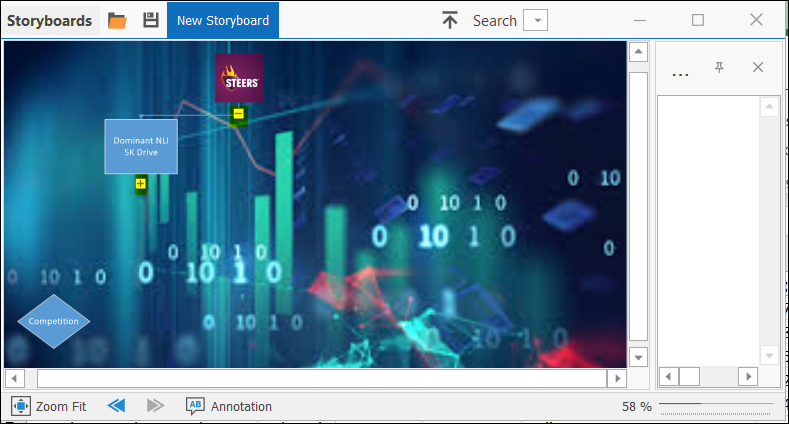
❖You can zoom in and out of your StoryBoard scene by clicking the appropriate point on the line at the bottom right corner of the window. I set it to 106 %. Move around by also using the scroll bars at the bottom and on the right.
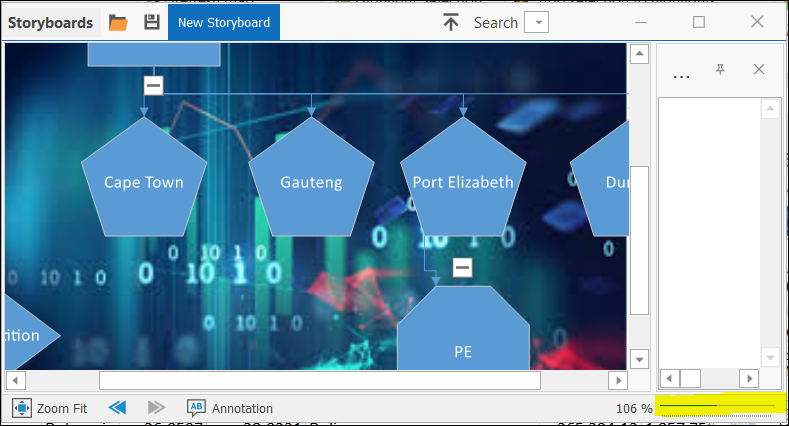
❖Click Zoom Fit to zoom fit to all the data on the StoryBoard scene.
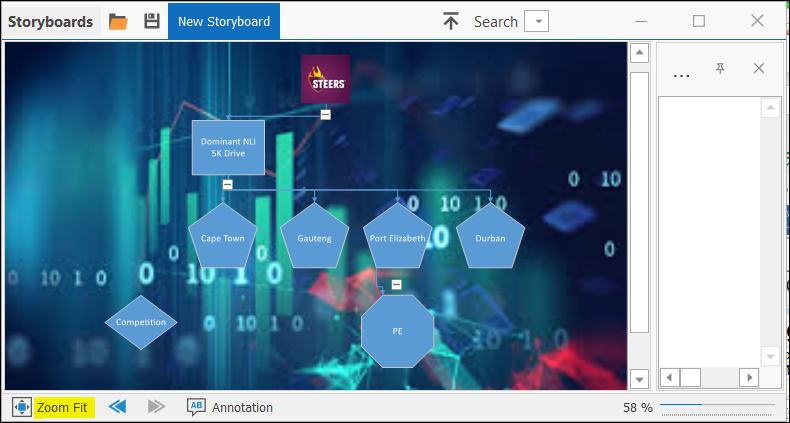
❖The left and right arrows at the bottom of the window allow you to view previous and next when navigating through your StoryBoard.
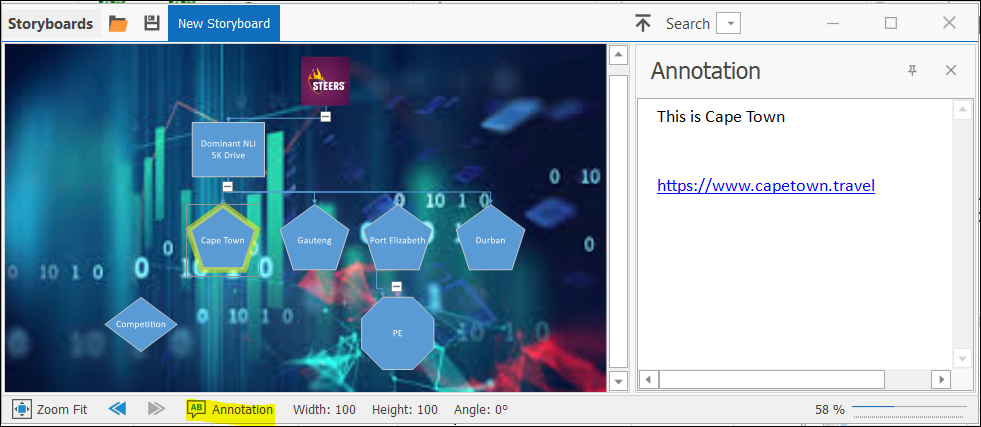
❖Select Annotation at the bottom of the window to display any annotations that were previously set up for the nodes. Selecting Annotation again will remove the display of them.
❖Cape Town is selected here which does have an annotation set up. There is even a hyperlink in the annotation that was set up.
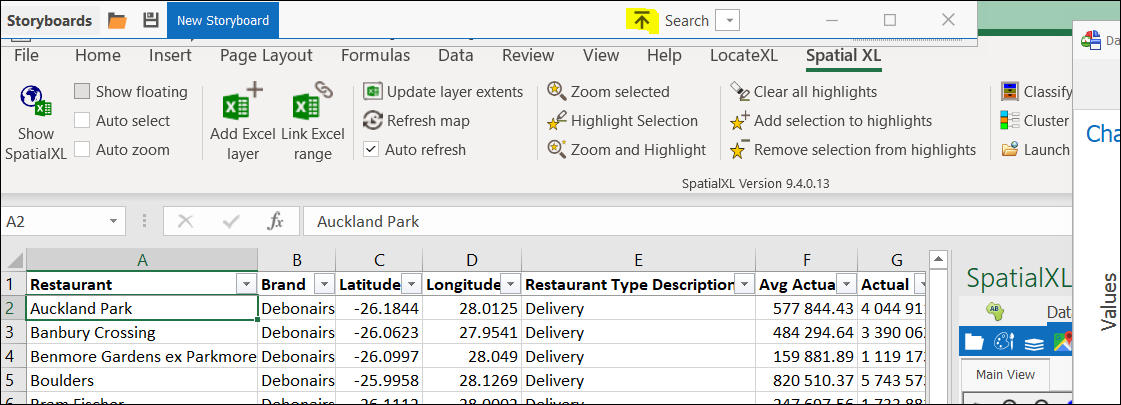
❖When doing a demonstration or presentation using StoryBoards, the window can sometimes be in the way. By clicking the up arrow on the top of the StoryBoard window, the window will now be docked to the top left of your screen out of the way. Click on the up arrow again to open the window.
❖Click on the Save to file icon at the top of the window if you want to save the StoryBoard as a Story Board file to be opened later in the same Excel Workbook. (Note: If you try and open a Story Board file in an Excel Workbook that doesn’t have the same layers or sheets in Excel of the creation of the StoryBoard, your StoryBoard won’t display saved views correctly.)
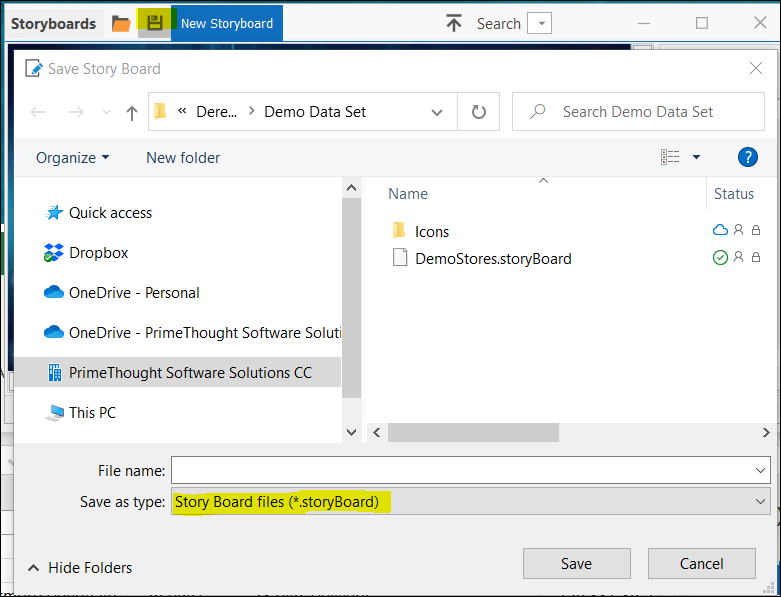
❖Click on the yellow folder next to the Save to file icon to browse to and open a Story Board file that was saved previously.
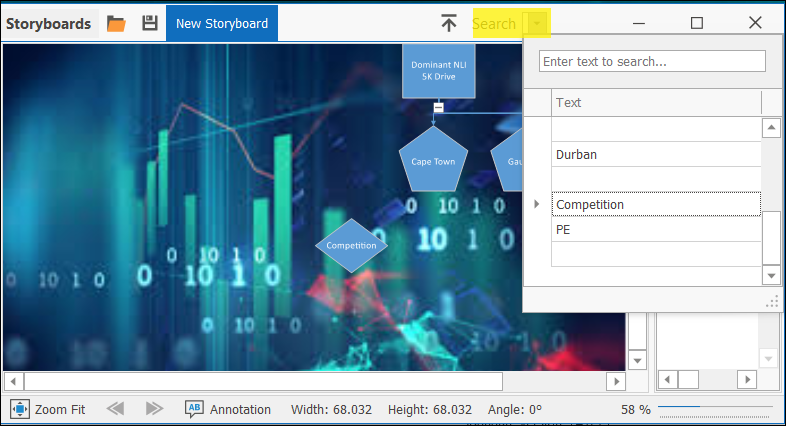
❖If you want to quickly search for a certain node on the StoryBoard scene, you can click on the drop-down arrow by Search on the top of the window and select or search for the node. The appropriate node will then be zoomed to. This is especially useful if you have many nodes on the scene.
Designing StoryBoard
❖You need a license file stating Storyboard in its description to enable you to create your own StoryBoards. When the license file is loaded into SpatialXL this will also be evident in the License Status.
![]()

❖Open StoryBoard now. You will see that there is now a button Presentation present.
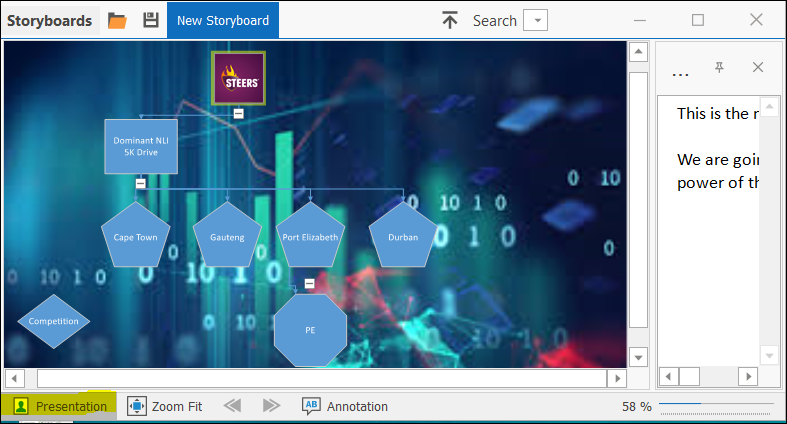
❖StoryBoard is in Presentation mode because it was left in this state when closing it previously.
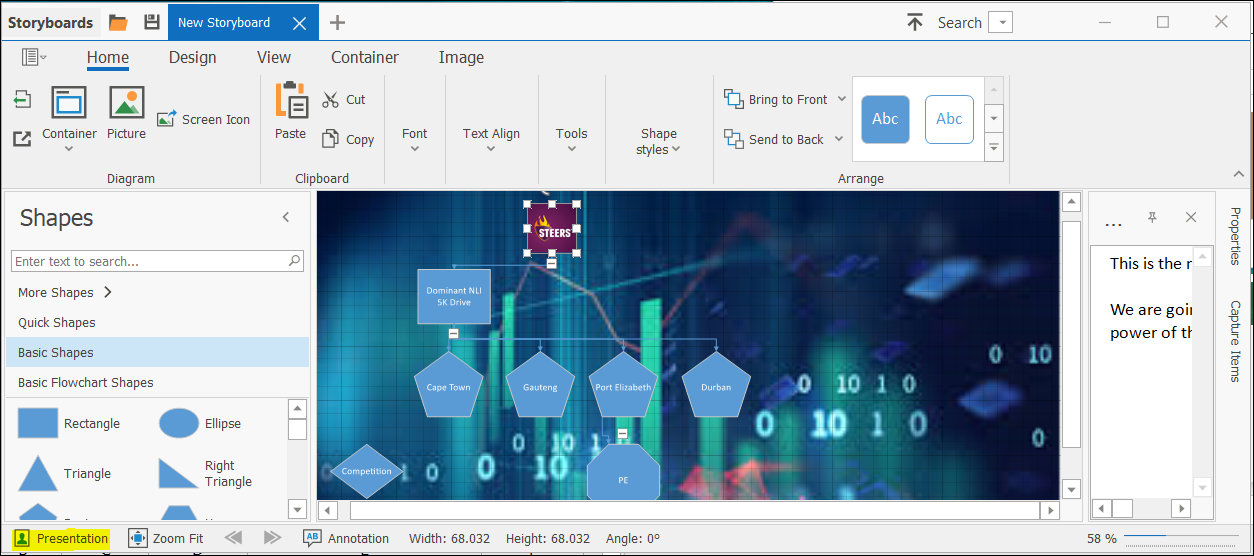
❖Click on Presentation to take it out of Presentation mode. You are now in design mode to create your own StoryBoards.
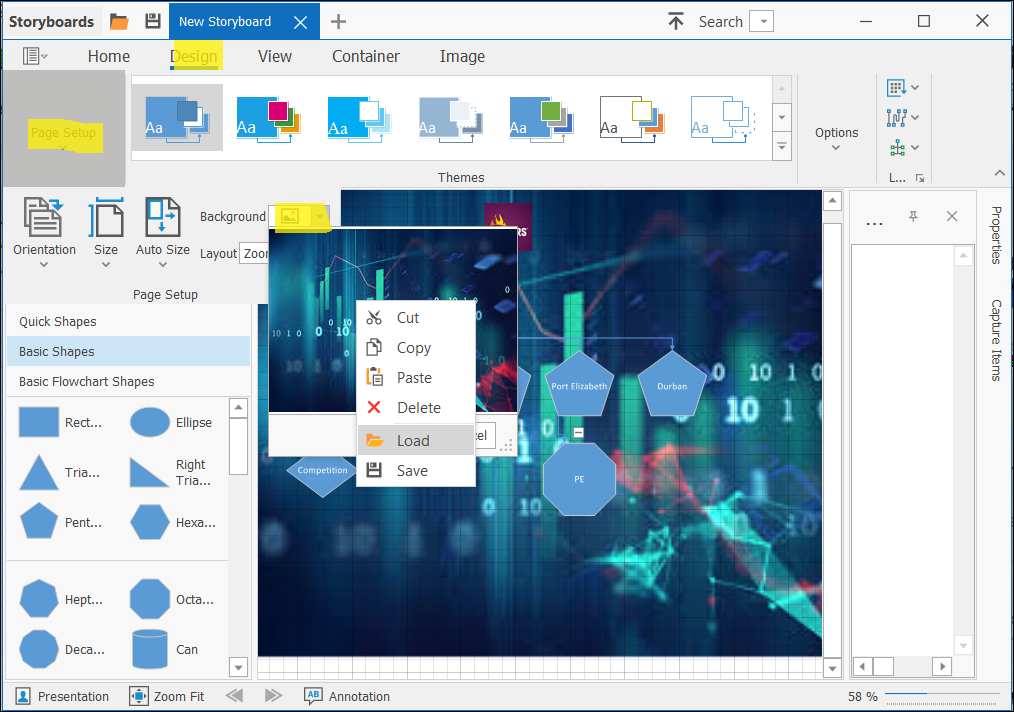
❖To set a background picture, select the Design tab. Then click on Page Setup. Select the drop-down arrow by Background, right click in the area and choose Load.
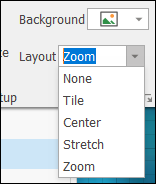
❖In the Layout option underneath Background, you can choose how you want the Background to be displayed.
❖Go back to the Home tab. To add nodes, simply select a shape and drag it to the appropriate position on the background. If you want a picture like STEERS that was added, click on Picture and load one from your machine.
❖By double clicking one of the shapes that were added, you can add text on them. You can change the Font etc by using the appropriate drop-down arrows in the top ribbon.
(NOTE: Before you even select a shape or add a picture etc., you need to follow the steps below on Capture Items.)
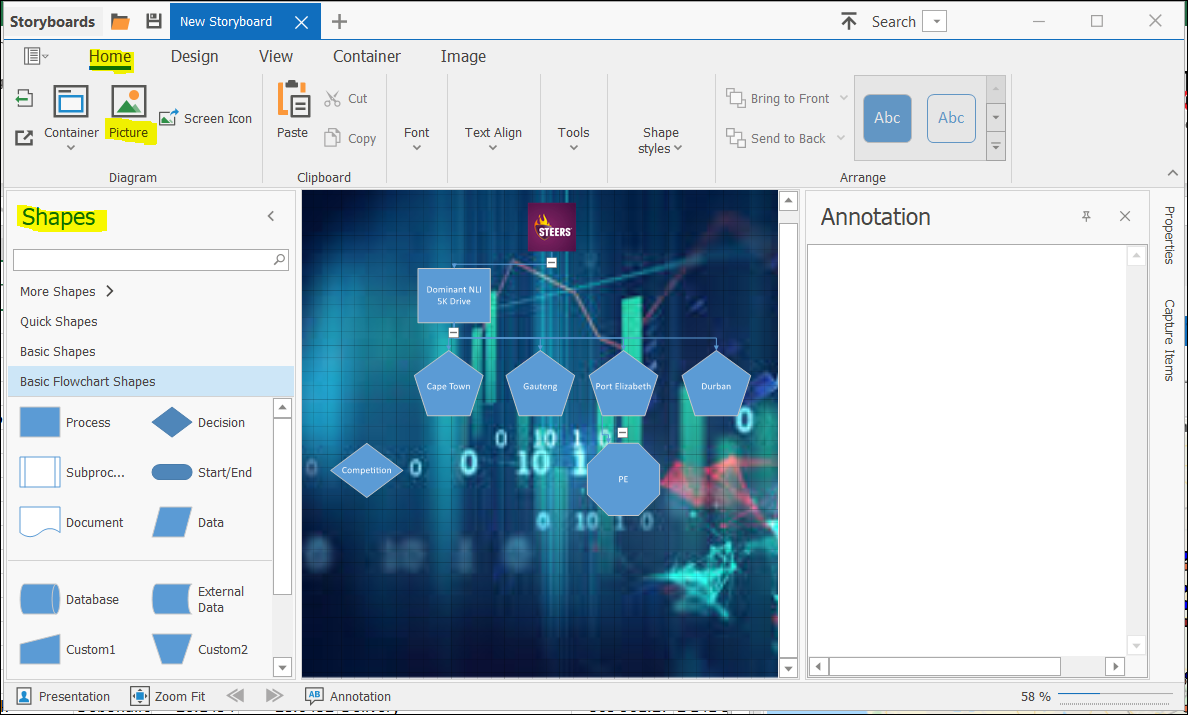
❖Keep in mind what shape or picture you would like to add then select Capture Items which is along the right on the window. This is also accessible from the View tab > Panes > Capture Items.
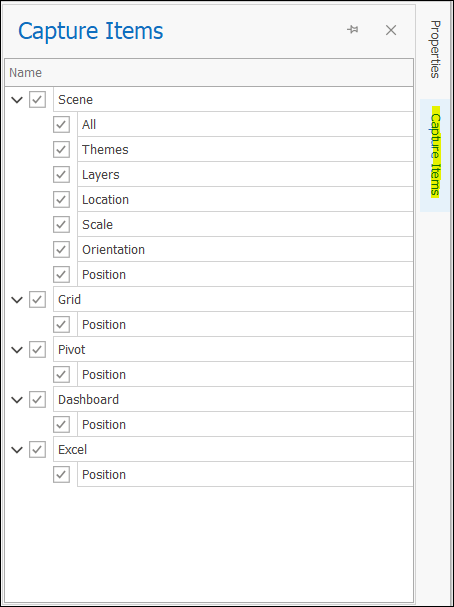
❖The above list is the list of items you can capture to set the screen state for each node. All are checked in this example. You can check any off if you don’t want to capture the screen state of those items.
❖The next step is to turn on or off any layers in your Layers Description box.
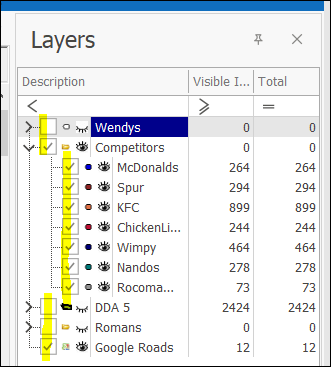
❖Zoom in or out to the extent you want captured on your scene.
❖Select the sheet in Excel that you want captured.
❖Open Dashboard Viewer if you want that captured as well.
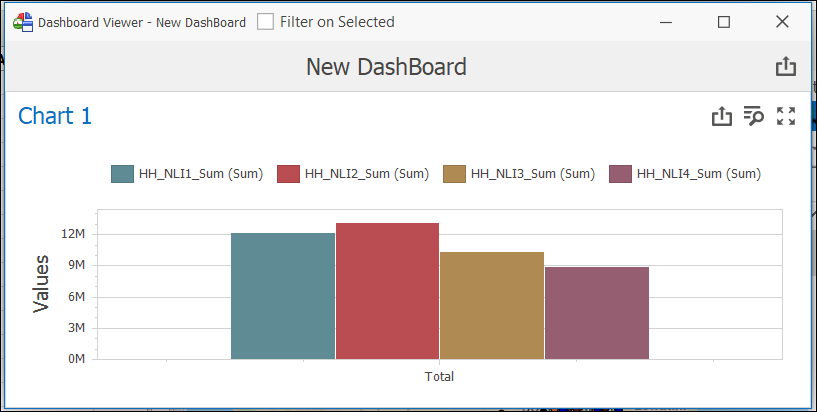
❖You can literally capture the state of virtually everything in Excel and SpatialXL or any of our other spatial applications per Capture Items.
❖Once you are done with this step, you can now select the appropriate shape or picture like STEERS above and drag it onto the diagram to the position you choose. The screen state will then be set for that specific node.
❖Continue in this way setting up the screen states for all your nodes. Remember to set Capture Items first before selecting the shape or picture to be dragged onto the diagram.
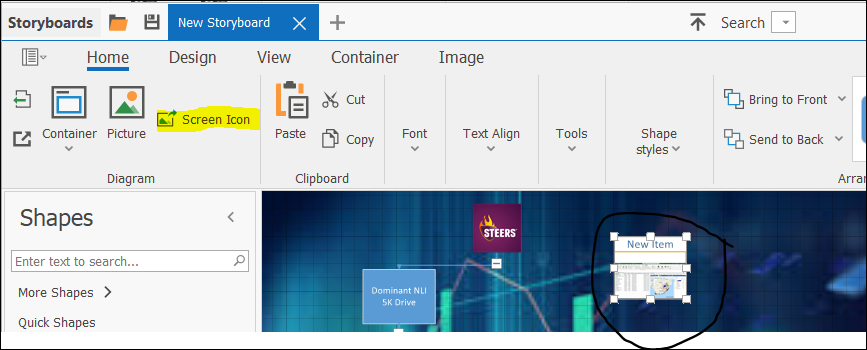
❖You can also select Screen Icon which will capture the picture of your entire screen and the exact screen state. Ensure you are first zoomed into, with the appropriate layers on or off etc. before selecting Screen Icon per Capture Items.
❖Select Screen Icon. A box with the picture of the entire scene is added. Click on it and drag it to the appropriate position. Double click on it to change the name.
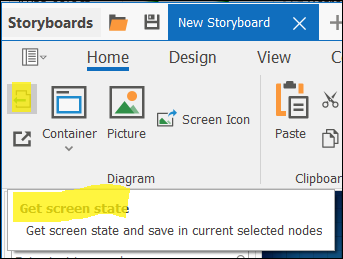
❖To change the screen state of a node that you had already set up is simple. Select the node that you would like to change. Then zoom in to your scene, turn layers on or off etc. and ensure the correct Capture Items are checked on or off.
❖Select Get screen state.
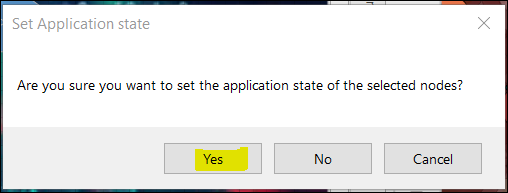
❖Click Yes on the window that comes up.
❖That node is now re-set.
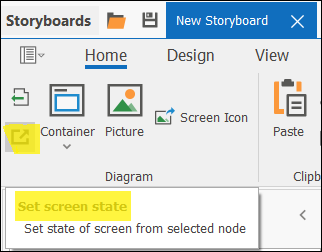
❖At any time during the setting up of the screen states you can select any node that was set and select Set screen state to remind you of what you had set up. Note that Set screen state will not change the screen state of the node that you are on, it only shows what was already set up.
❖To delete any nodes, select them and press the Delete key.
❖You can use Annotations for your nodes. Make sure that the node you want to create annotations for is selected. Then click on Annotation at the bottom of the window. A window will come up and be docked to the right. Type in your annotation. Click on Annotation again to remove the Annotation window.
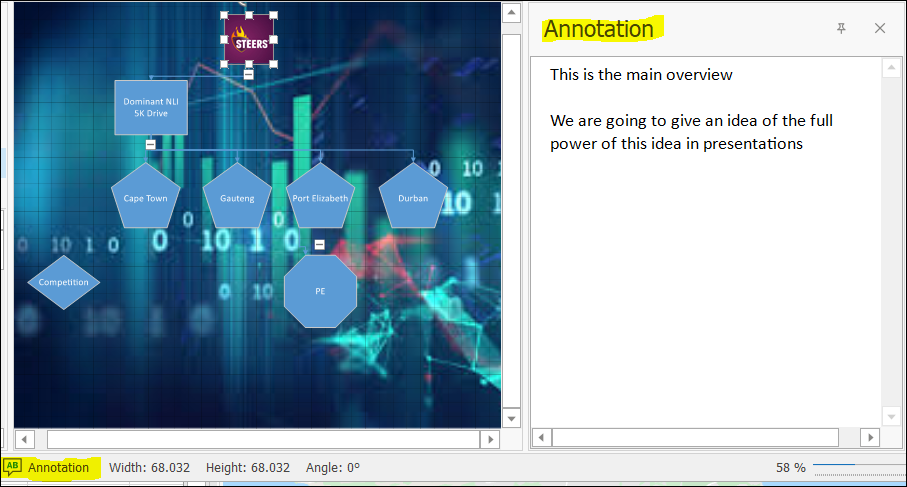
❖Continue in this way creating Annotations for your applicable nodes. You can also create a hyperlink for your annotation. Type in your text and then highlight it. Right click and choose Hyperlink.
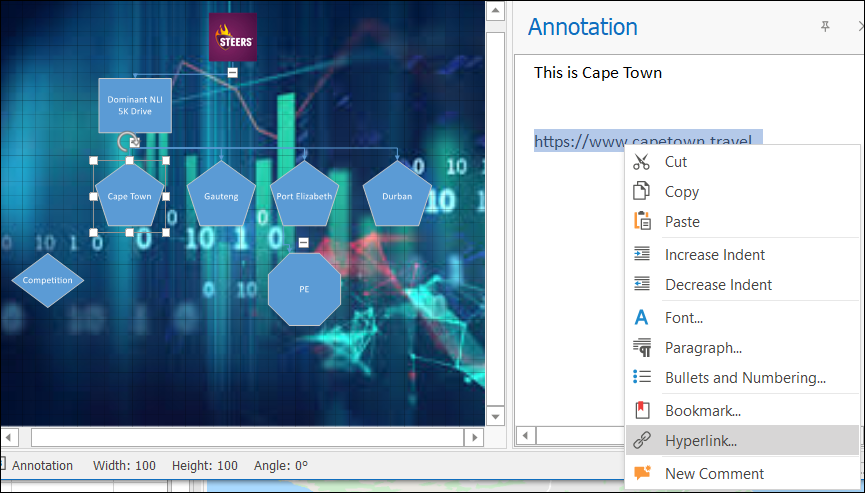
❖A window will come up for you to create the hyperlink. Fill in the appropriate data.
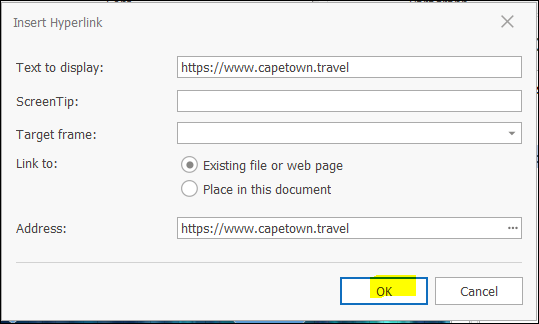
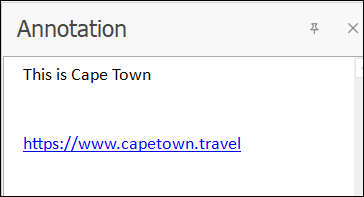
❖Click OK. The hyperlink is now created.
❖If nothing is selected on the diagram, you can have a default Annotation which will display whenever nothing is selected.
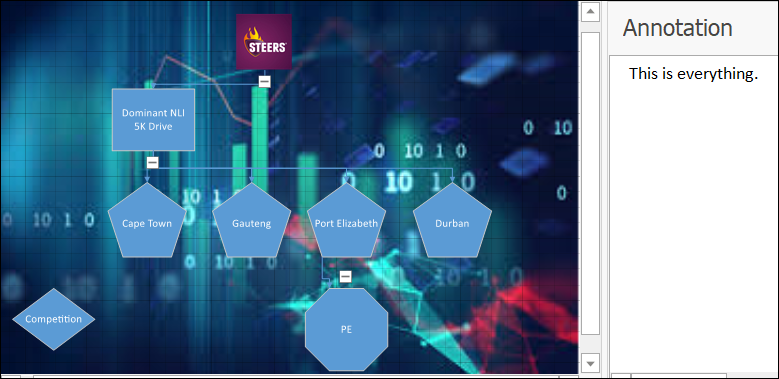
❖There are other things you can Insert etc. into your Annotation window. See the ribbon in the screenshot below.

❖Draw Connectors between your objects for organized structure of your objects. Select Tools then Connector.
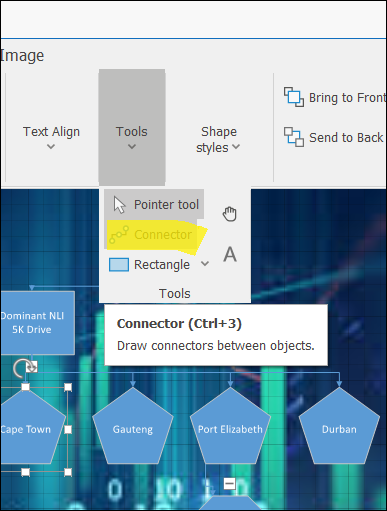
❖Your cursor will then look different with a little connector below the pointer. This shows that the Connector tool is active. If you move your cursor on a node a crosshair will be displayed illuminating different areas of the node to start drawing the Connector from.
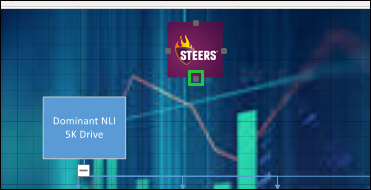
❖Click on that point and drag your Connector to the appropriate point on the node you are wanting to connect to.
❖You can then click on and drag the vertices to the shape of the Connector that you want.
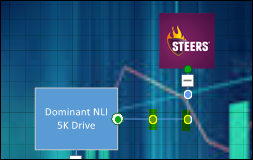
❖Click somewhere else in this window to see the Connector now drawn.
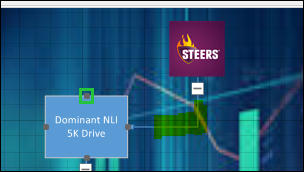
❖Continue in this way creating Connectors. If you want nodes to be in the same containment and not continuously containing each other, then click on the appropriate point on the node (not on the expand/collapse symbol) and drag Connectors from there to the nodes one at a time that are to be contained together.

❖There are different types of Connectors that can be used. Per the screenshot above, Right Angle is the type of Connector being used. Go to the Design tab > Connectors and choose a different one.

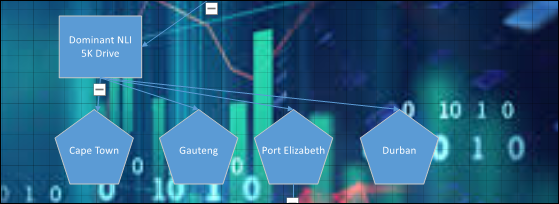
❖Once you are done using the Connector tool, go back to Tools and select Pointer tool. This turns the Connector functionality off, otherwise it will stay live.
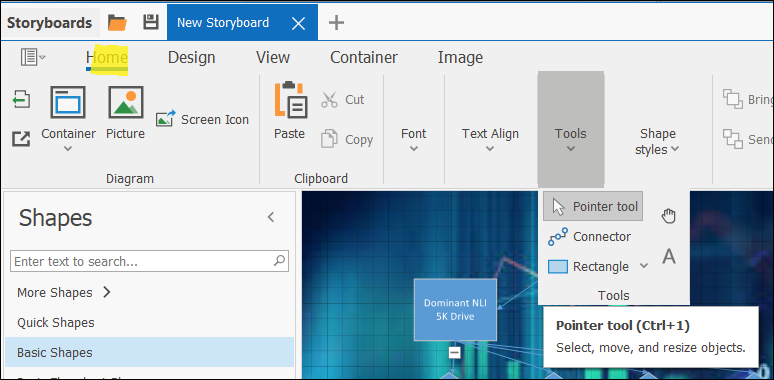
❖Currently, New Storyboard is the name of the StoryBoard being created. You can rename it by right clicking on it and then Rename.

❖Click on the Save to file icon at the top of the window if you want to save the StoryBoard as a Story Board file to be opened later in the same Excel Workbook. (Note: If you try and open a Story Board file in an Excel Workbook that doesn’t have the same layers or sheets in Excel of the creation of the StoryBoard, your StoryBoard won’t display.)
❖Click on the yellow folder next to the Save to file icon to browse to and open a Story Board file that was saved previously.
❖If you want to quickly search for a certain node on the StoryBoard scene, you can click on the drop-down arrow by Search on the top of the window and select or search for the node. The appropriate node will then be zoomed to. This is especially useful if you have many nodes on the scene.
❖You can create another StoryBoard at the same time by clicking the + next to the StoryBoard name. You can also open more than one Story Board file at the same time.
![]()
❖If you are going to do a presentation or demonstration, you should click on Presentation to put your StoryBoard in that mode before closing it. This ensures that the next time you open it up, you can start presenting and demonstrating immediately.
❖If you are also publishing your data to Spatial Reader Files, ensure to have your StoryBoard in Presentation mode before you publish. This ensures that anyone who then gets the Spatial Reader Files can view StoryBoard correctly.
Note: You need a specific description in your license file to publish Dashboards and StoryBoards to Spatial Reader Files.
![]()
If you do not have this description in your Spatial Publisher license file, you will be able to publish everything else in SpatialXL except for Dashboards and StoryBoards.