Section Charts
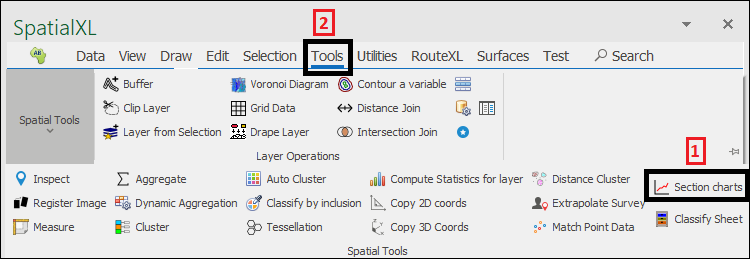
❖Section Charts(1) is a feature available in all our spatial products that allows you to create charts representing exact sections of a surface that intersect the viewplane. It is found in the Tools tab(2):
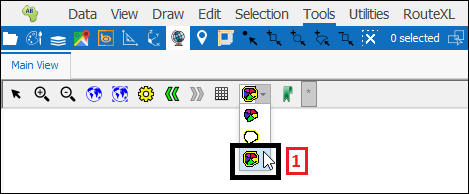
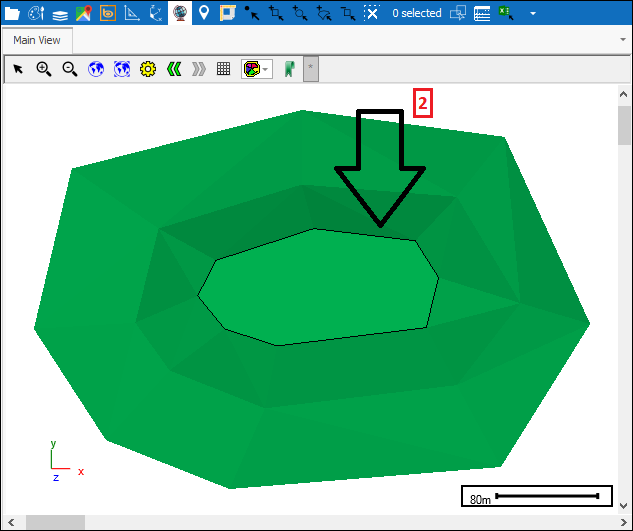
❖Firstly you can have the following display type put on(1) so you can easily see the exact part of your surface that is intersecting the viewplane(2):
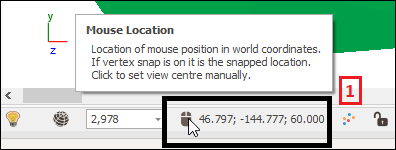
❖You can then move to the desired depth in the scene, to have the desired section intersecting the viewplane, by clicking the Mouse Location button(1) and then in the Set View Center dialogue(2) use the plus and minus buttons(3), which alter the Z value, to move in and out, Shift Amount(4) is the amount you would like to move by:
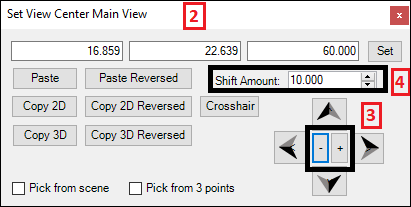
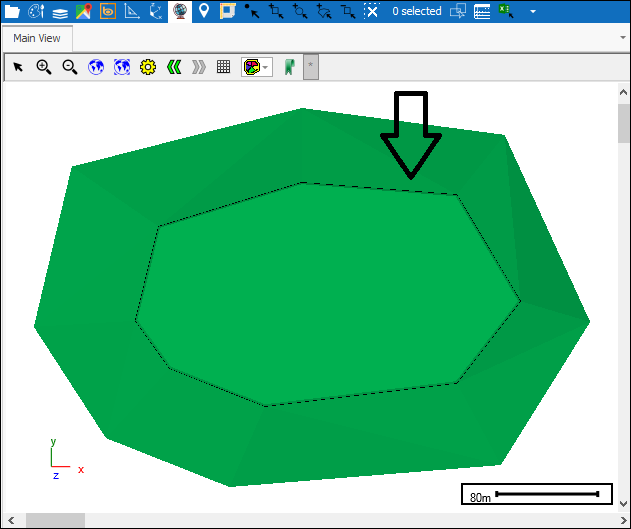
As you can see as I press the plus button I move into my object and the section of my surface intersecting the viewplane has changed:
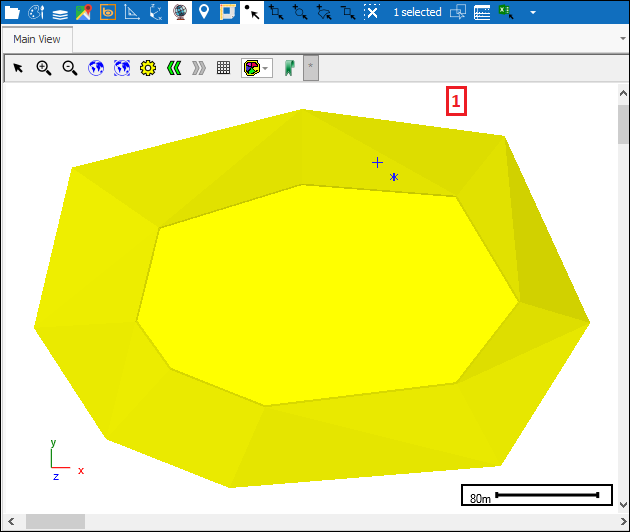
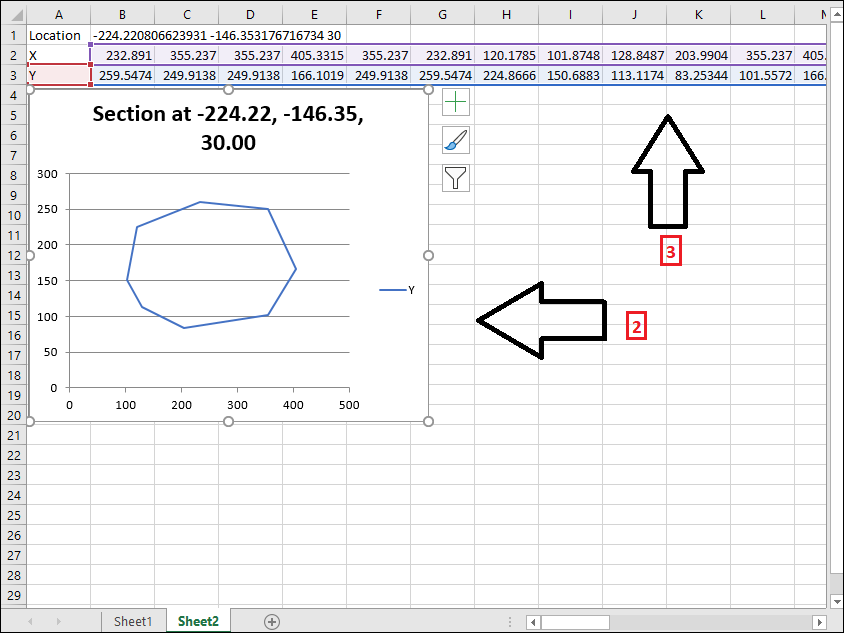
❖Once you have the desired part of your surface intersecting the viewplane you can go ahead and select the surface(1) and then click the tool and a chart of that exact section is created for you in Excel(2) along with details about the exact location of the section(3):
