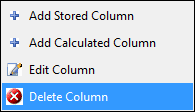
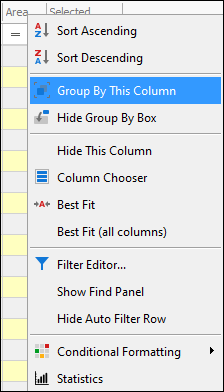
❖Right clicking in one of the column headers or the column header area will bring up the following context menu:
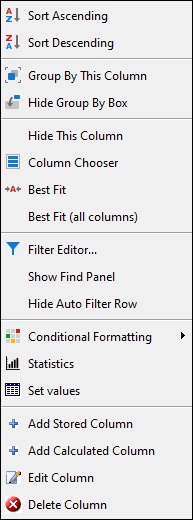
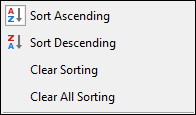
❖You can sort columns in ascending or descending order by clicking on the Sort Ascending or Sort Descending buttons. The column header will then have an upward or downward arrow to indicate that the column is now sorted in ascending or descending order:


To clear sorting right click again and then click Clear Sorting to clear the sorting for just that column or Clear All Sorting to clear sorting for all columns:
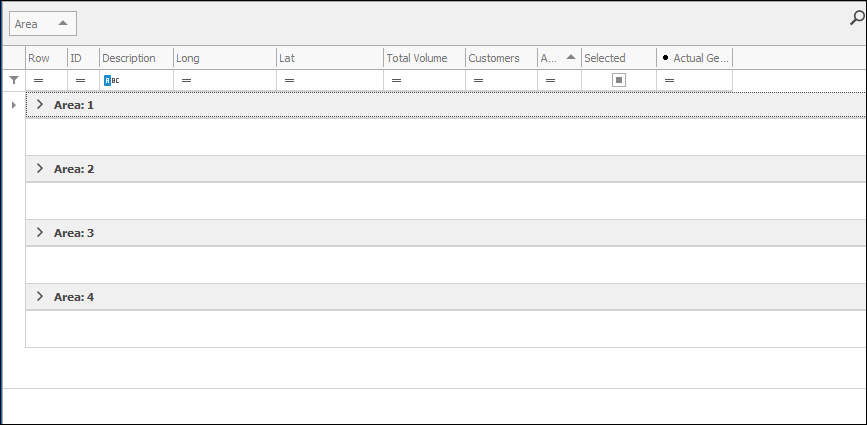
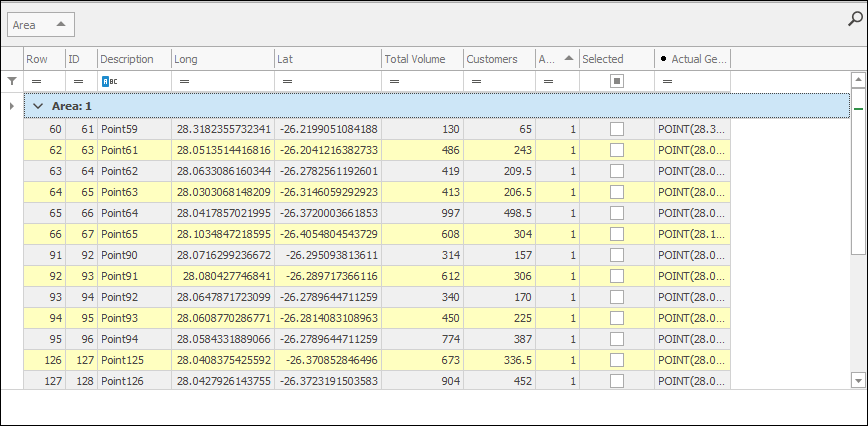
❖To group your data by a certain column, click Group By This Column, your data is then grouped and you can dropdown on one of the groupings to see all records that fall in that category:

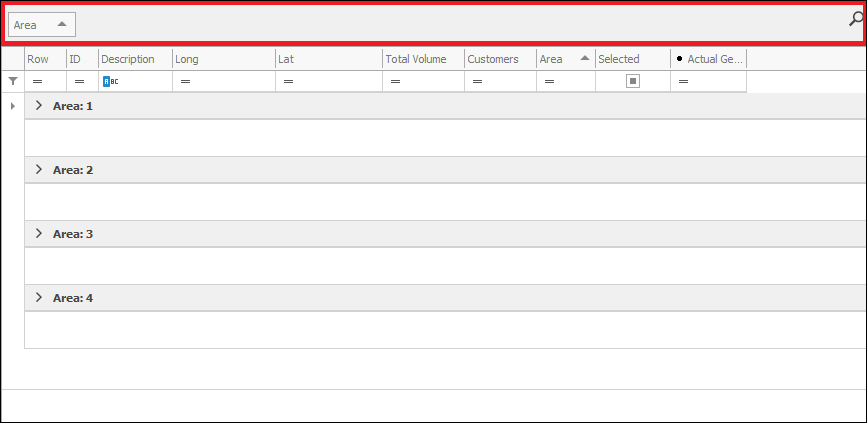
The Hide Group By Box button will hide the grouping area:

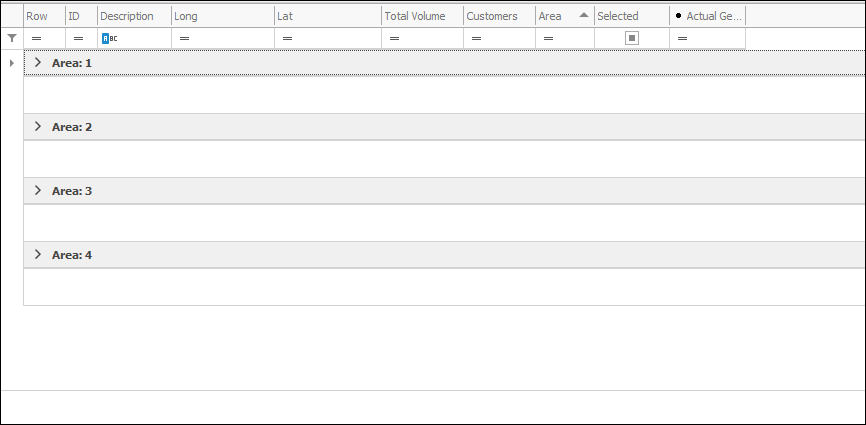
To unhide just right click again and click the Show Group By Box:

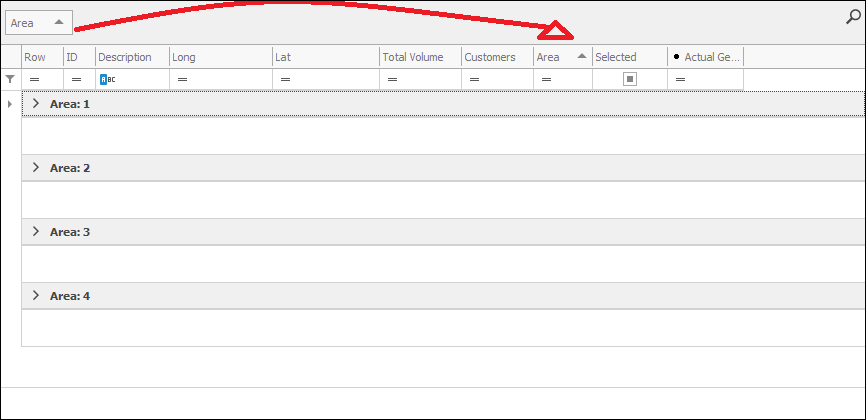
To ungroup you can right click again in the appropriate column header and click Ungroup (you can also just drag the column header out of the grouping area back to the grid and this will ungroup it too):

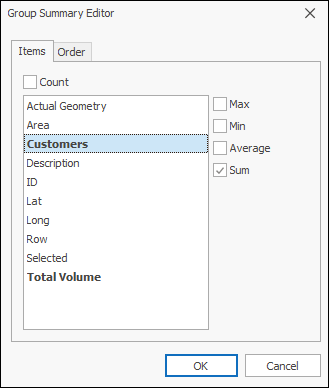
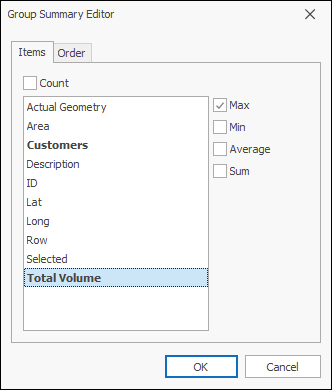
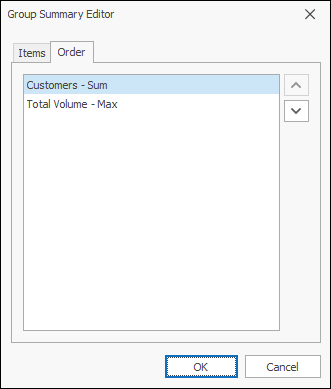
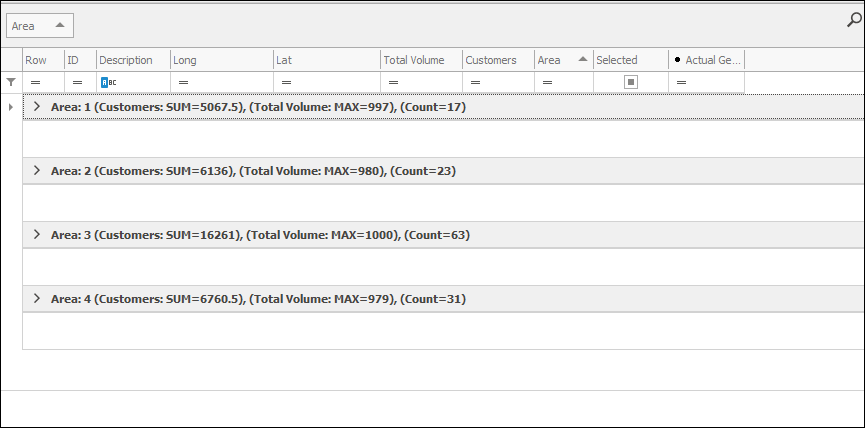
❖Group Summary Editor will bring up a dialogue where you can add some calculations to your grouping setup, here I chose to have the Sum of Customers shown and the Max Total Volume, you can choose the order in which they are shown in the Order tab:

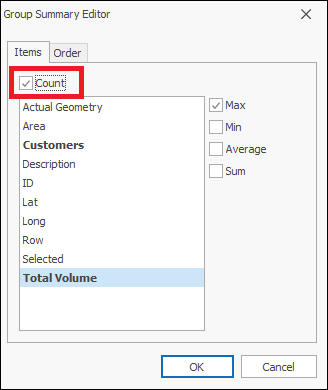
Ticking on Count will also include a count of the items:
❖In grouping by columns, you are able to group by more than one column at once. You can start by grouping by one column and then all subsequent columns you group will act as subgroupings, and as mentioned before, grouping can be done by either dragging and dropping column headers in the grouping area, or by right clicking on the column header and choosing Group By This Column:

or
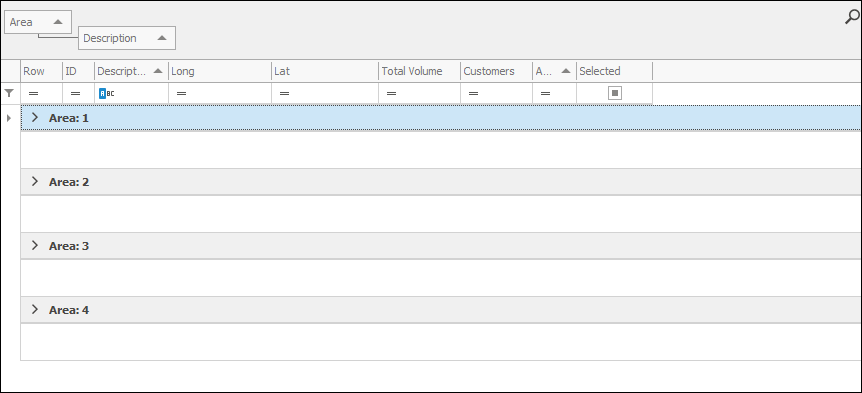
In this example I have grouped by two columns, the first being Area and the second being Description:
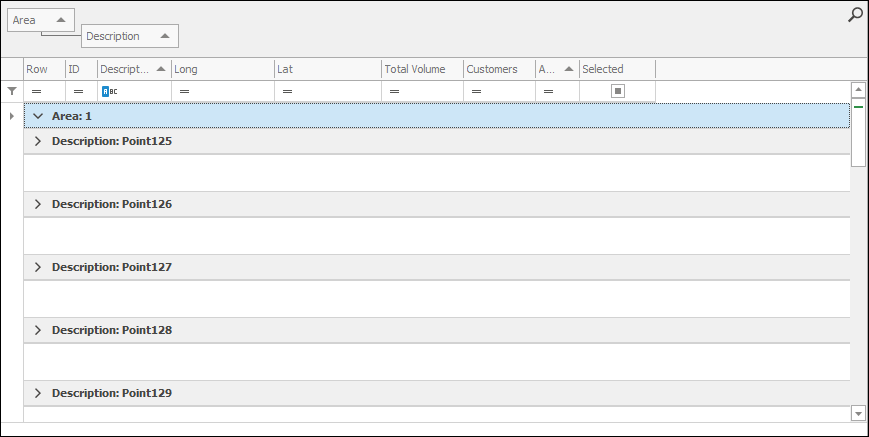
When I dropdown on Area 1 you see the second grouping:
❖You can choose to hide columns by right clicking in the appropriate column header and selecting Hide Column:
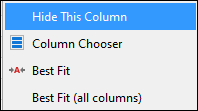
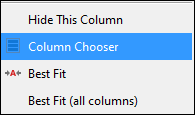
❖Column Chooser will bring up a dialogue where you can choose which columns to have shown and which to have hidden by dragging and dropping columns into it that you want hidden, and double clicking on columns inside it to have them shown:
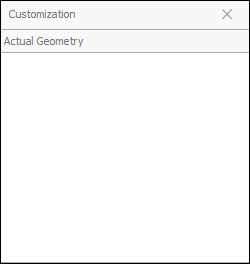
As you can see the Actual Geometry column is in this box which means it is hidden and if I want to show it, I double click on it and now it is part of my grid:
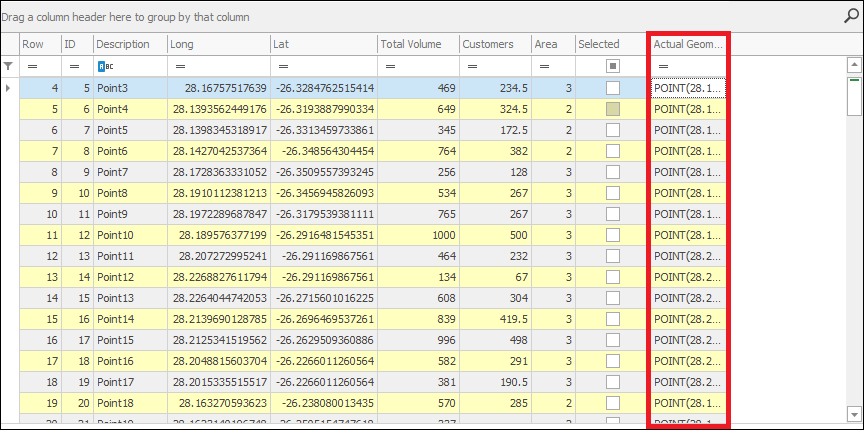
If I want to hide my Total Volume column I just drag it and drop it in this box:
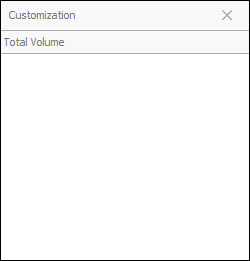
And it is now no longer showing in my grid:
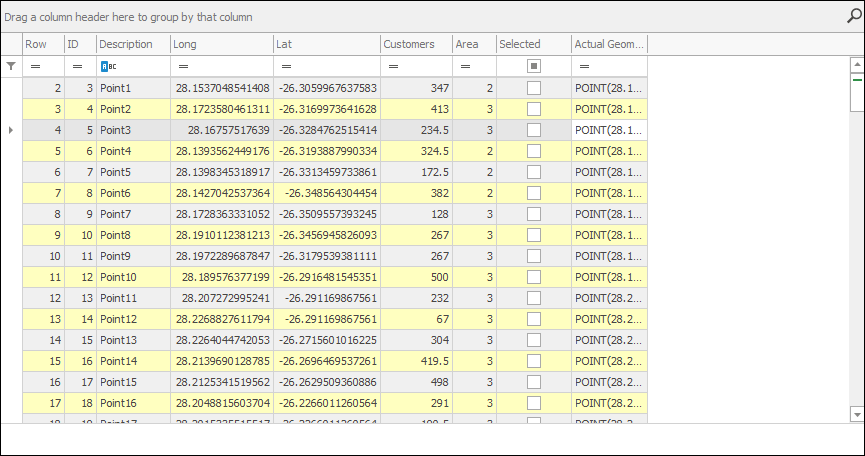
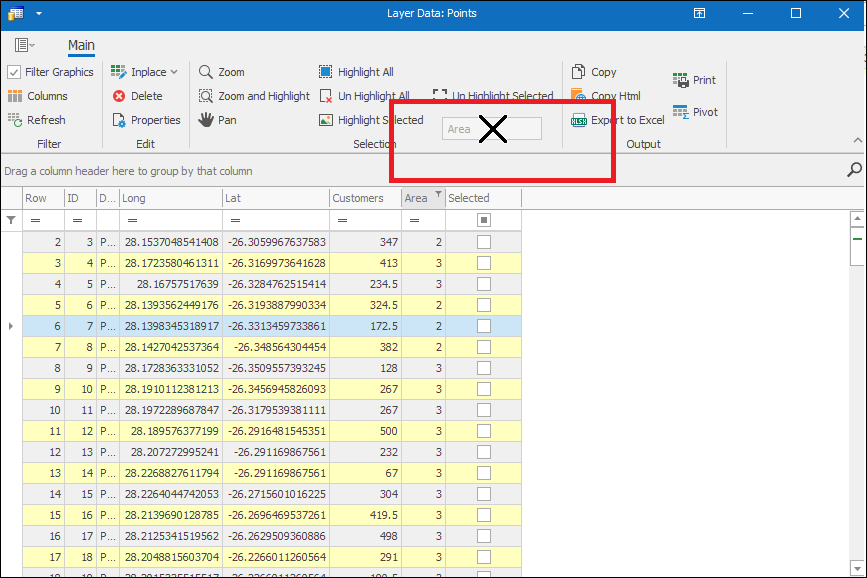
❖Another easy way to hide a column from your grid that you don’t want showing is to simply drag it all the way to the ribbon area of the Layer Data Grid until a cross symbol shows and then just drop it:
❖The Selected column is a column that you can choose to have showing in the grid that will show you with a tick what is selected in the scene currently, you can then also filter by clicking in the box above to have only unselected items showing and click again to have only selected items showing:


This column can be added via the Column Chooser box discussed above. Just double click on it here and it will show in your grid:
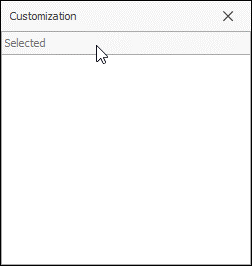
❖To optimally size columns right click in the appropriate column header and click Best Fit:
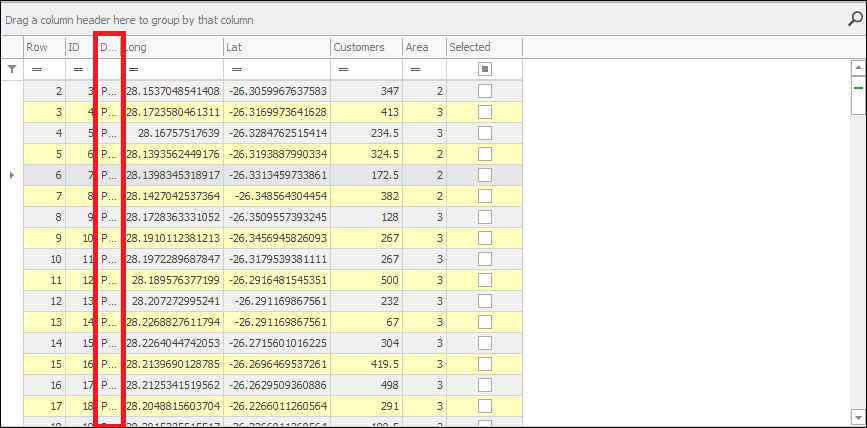

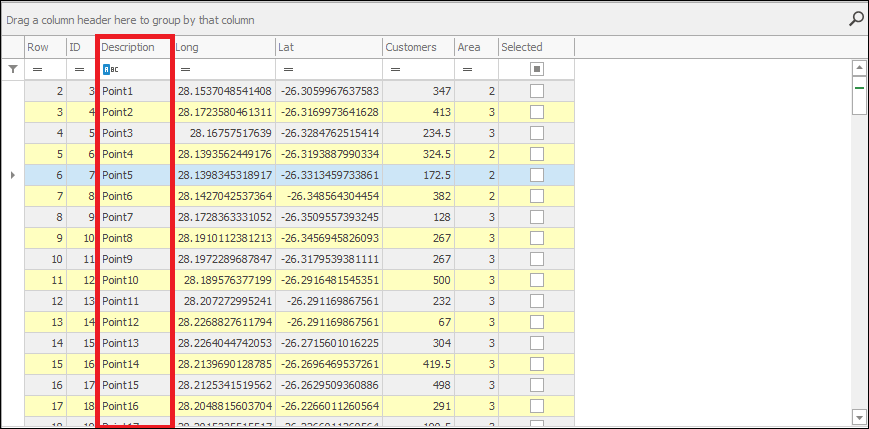
To do this for all columns click Best Fit (all columns):

❖Filter Editor will bring up a dialogue where you can customize filters exactly as you what you want:

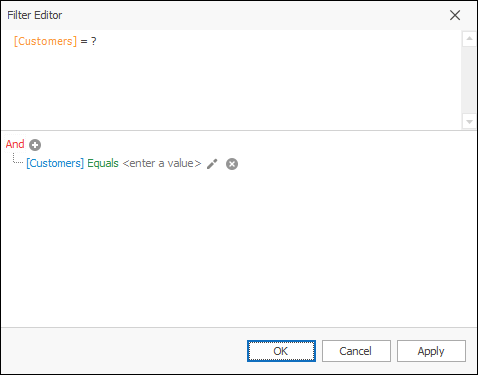
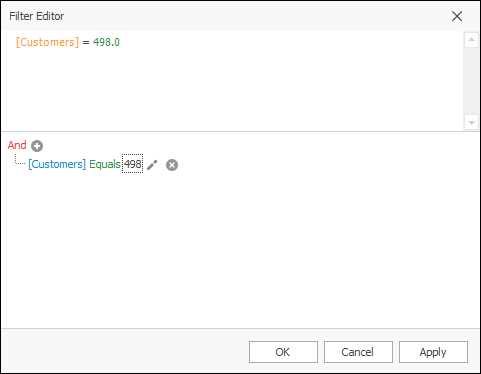
The top part shows the full expression for the filter you are specifying and the bottom part is where you specify the filter. Here (bottom part), click on any one of the elements to change them:
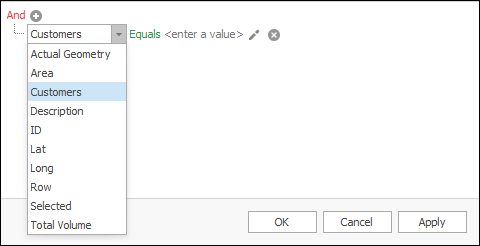
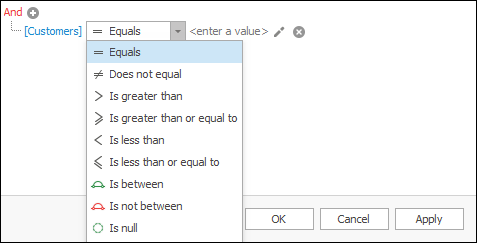
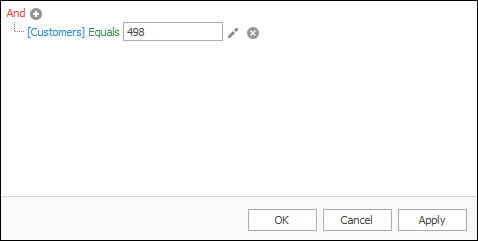
So, so far you can see I have made a filter which says Customer column is equal to 498:
You can then add a new condition to this filter you are creating by clicking the plus symbol; if you want this to be an And condition then leave it as And, otherwise you can click on this and choose it to be any other type of condition. I will make it an Or condition:
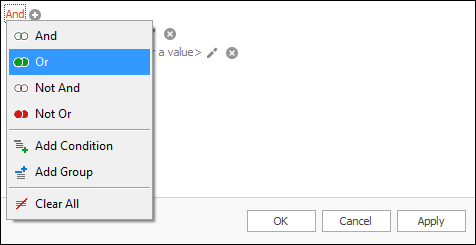
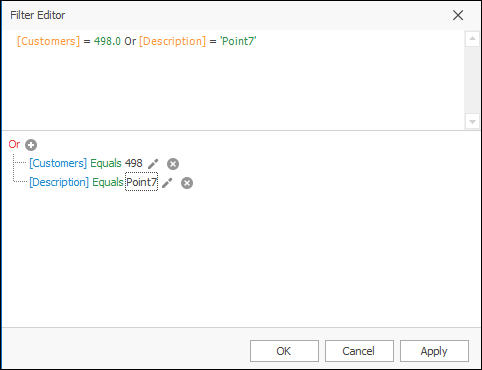
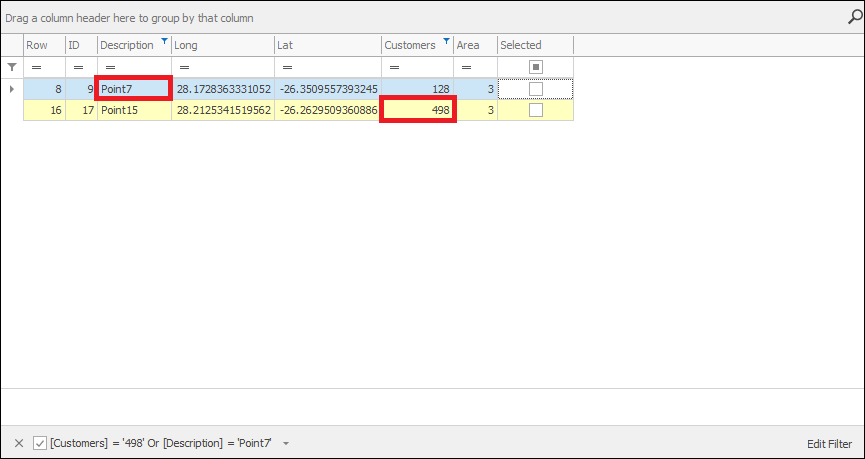
And now as you can see here, I have made a filter which says Customers equals 498 Or Description equals Point7. I can then click OK (or Apply if I want to first see how the filter looks without exiting the window yet):

And this is the result of my customized filter:
❖To show the Find Panel, which is where you can search the whole grid, select Show Find Panel:

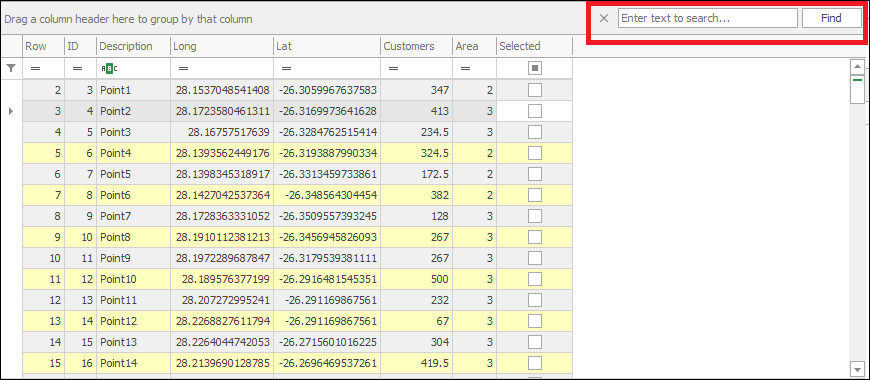
You can then right click again and select Hide Find Panel or simply click the X to hide it again:

![]()
❖You can hide the auto filter row by selecting Hide Auto Filter Row:

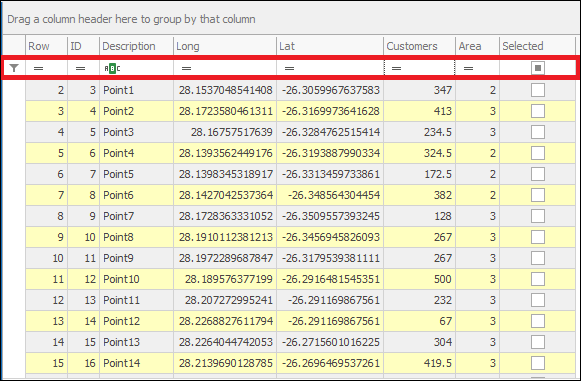
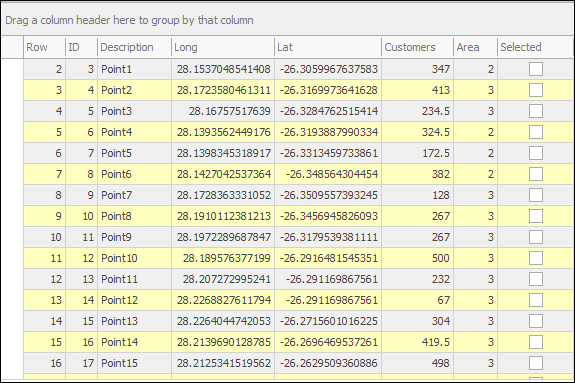
To unhide, right click again and select Show Auto Filter Row:

❖With Conditional Formatting you can apply various formatting to your grid just like in Excel:
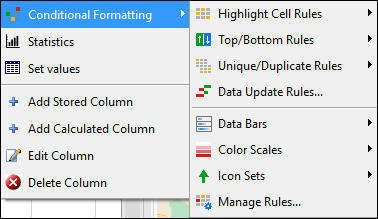
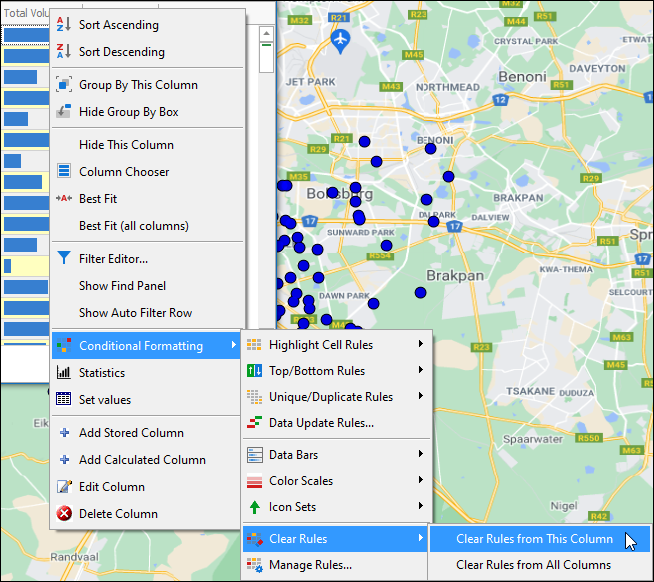
First right click in the column header of the column you would like to apply formatting to and then choose your desired formatting. As an example, here I will apply some Data Bars to my Total Volume column:
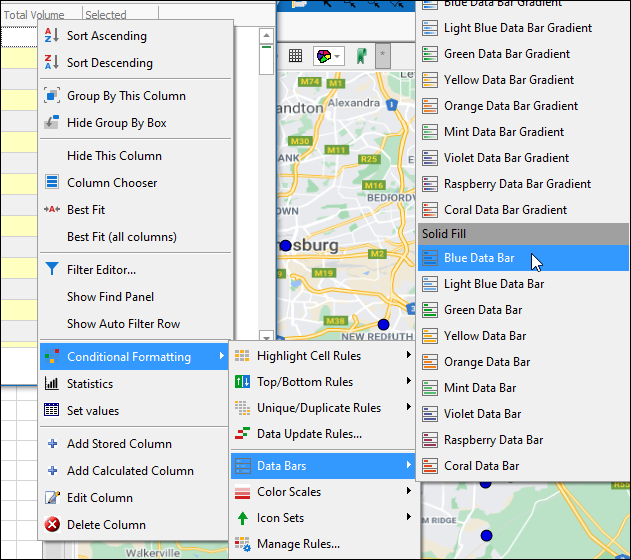
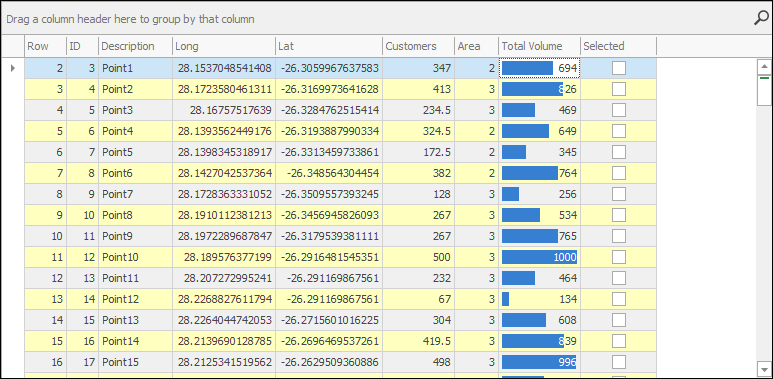
To clear any formatting once put, click Clear Rules and choose to clear formatting for just the column all for all columns:
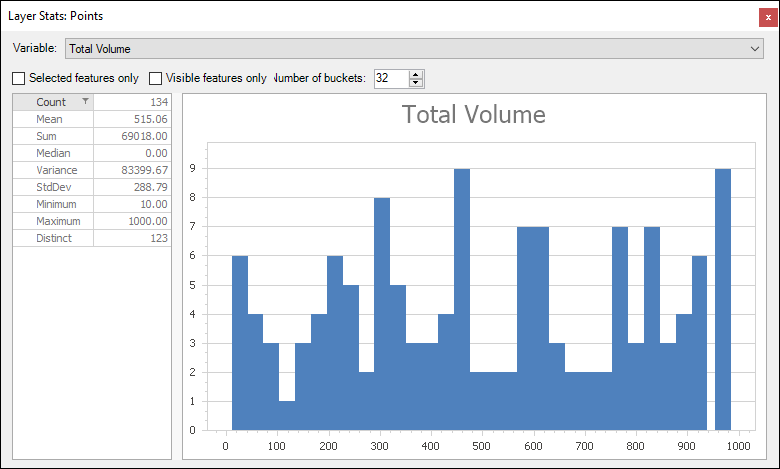
❖Statistics will take you to a dialogue with statistical data for that column. This tool is described fully in the Compute Statistics for Layer manual:

❖Set Values will bring up a dialogue where you can set values for a number of rows. First select the rows and then select Set Values. Choose the column you will be setting values for and then enter in the value you would like to set it to (the amount of rows you selected is shown in the bottom left of the dialogue as well).
If you would like to set the values to null have Null ticked on. Then click OK and your values will be set:


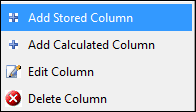
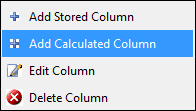
❖With Add Stored Column you are able to add a new column to your layer data grid. This will be a column that just holds values and doesn’t change based on some calculation. Click on it and it will bring up the following dialogue:
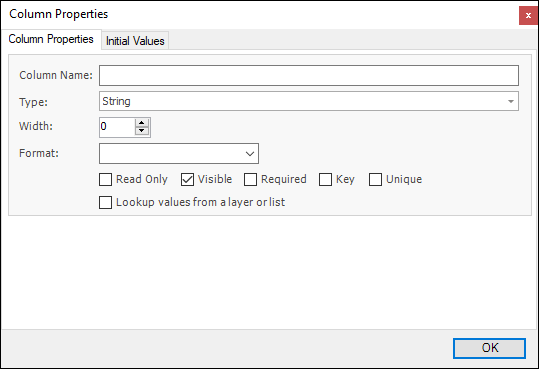
❖By Column Name enter in the name for the new column. Then enter in the Type of the column whether String, Integer etc. You can then specify its Width if you wish. You can then choose the Format of the values:
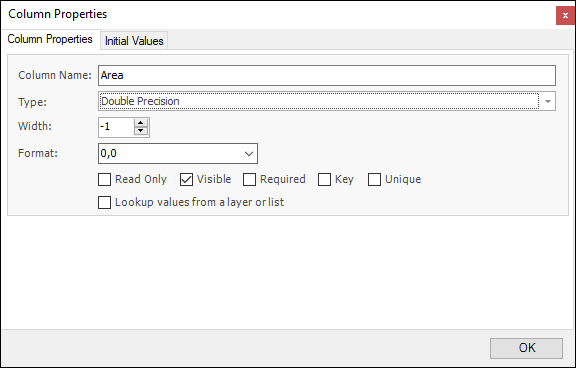
❖Now, you also have various options you can tick on or off regarding this new column. Tick on Read Only to make column read only; When Visible is ticked on it means the column will show, if it is off the column will be hidden; Required will require that a value be in this column for each record and will not allow nulls. Key will make the column a unique key column and Unique will make it so that no duplicate values will be allowed in the column:

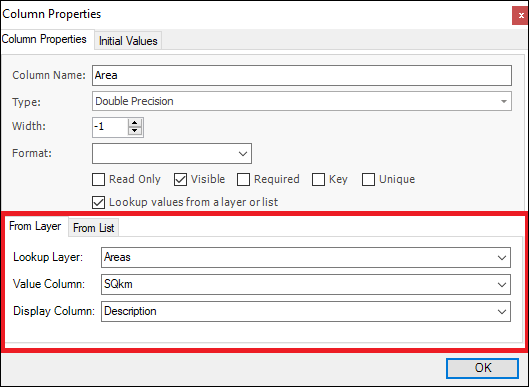
❖Ticking on Lookup values from a layer or list will bring up a dialogue where you can specify a layer or list from which you can lookup values and which will appear as a lookup table in the Layer Data Grid. To lookup values from a layer first choose the layer, then choose the value to be looked up and then choose the value to display. In this example I am adding a stored column called Area and I’m choosing to lookup values from my Areas layer and the value I am choosing to lookup is the SQkm of the area and the value that will display is the Description of the area:
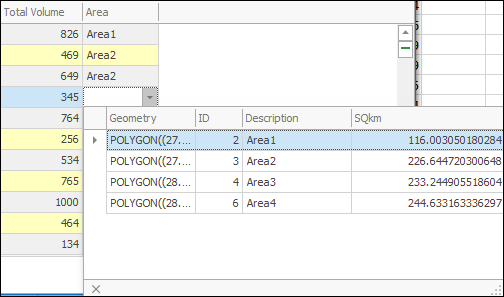
When I now want to enter in data in this column there is a lookup table for me to choose from:
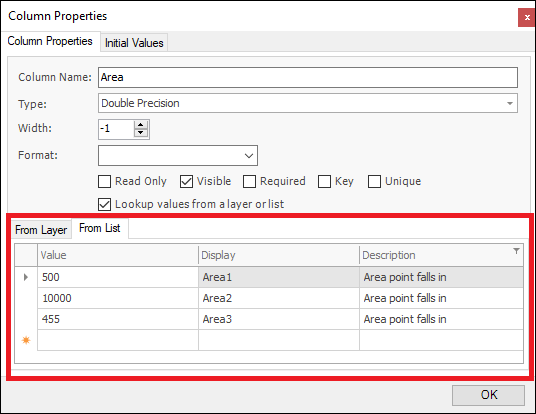
❖To lookup values from a list go to the From List tab and enter in the items in the list that will form a lookup table for you; the Value is the value the record will hold, the Display is what value will be displayed in the record and Description will just be in the lookup table as a description of the item:
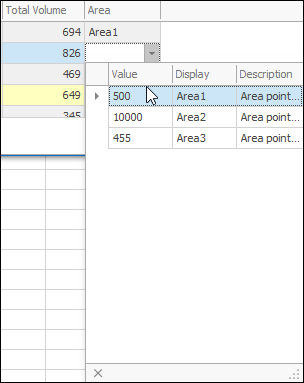
❖Once you have finished setting the new column’s properties you can click OK and the column is added; you can then enter in values in this column by typing or inserting from a lookup table you have specified:

❖Now, when you are done specifying the properties of the new column and have clicked OK, the column will be added in your Layer Data Grid as an empty column that you can enter values into, however you are also able to initialize values for a new column in the Initial Values tab:
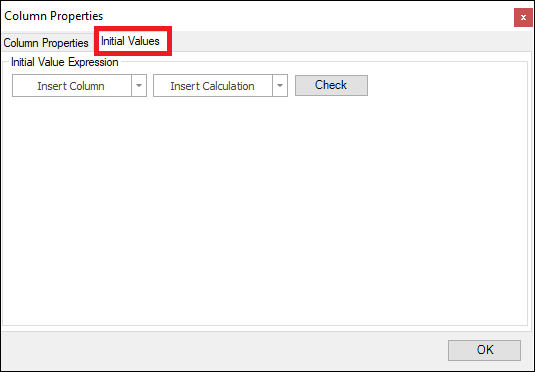
By dropping down on Insert Column you can choose a column from the Layer Data Grid to insert in the expression to get values from; by dropping down on Insert Calculation you can then choose a predefined calculation to insert into the expression:
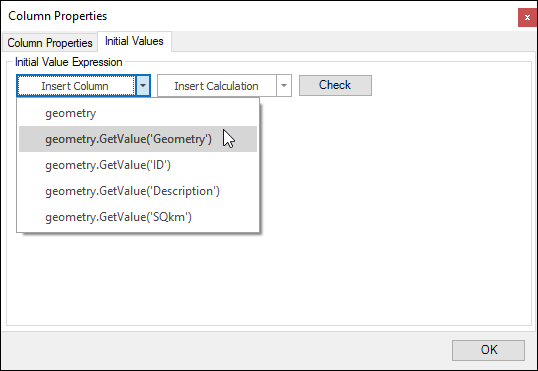
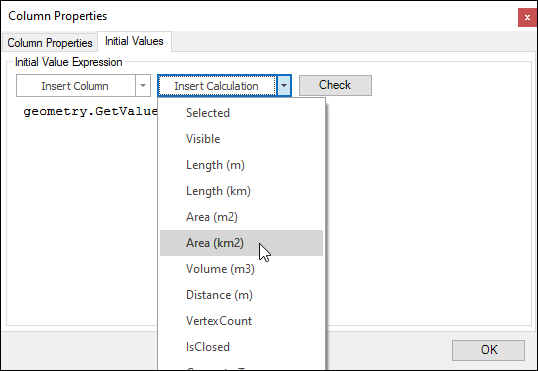
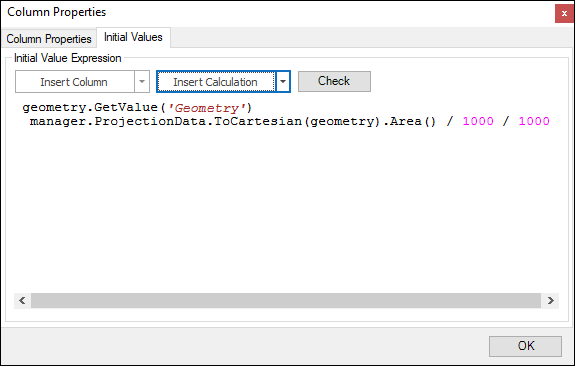
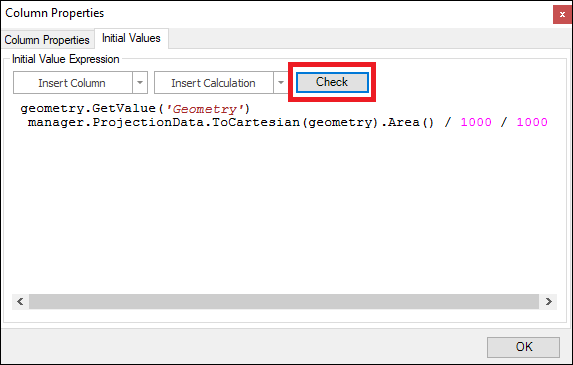
What I have said here is to get the geometries of the elements (which are polygons in this case) in this layer and then calculate the square kilometres of them. I can then click Check to see if this expression is correct and if so, it will let me know:
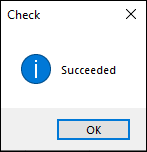
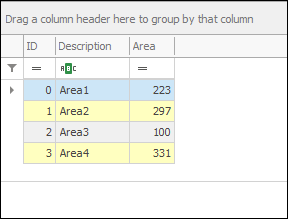
I can then click OK on this and the dialogue and you will see a column, which I have called SQkm, has been added with the initialized values of the square kilometres of the elements:
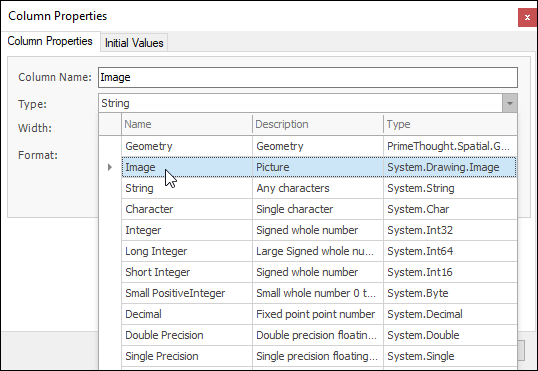
You can also add an Image type column when creating a stored column, this will allow you to store images for each record:
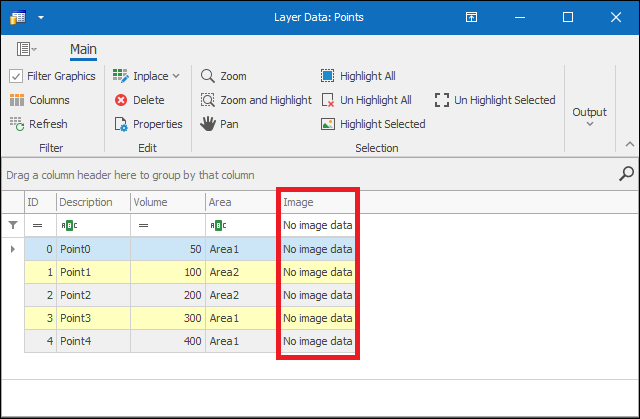
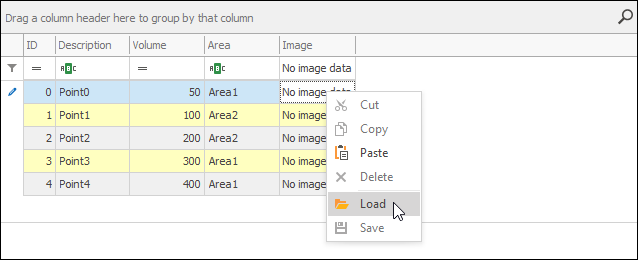
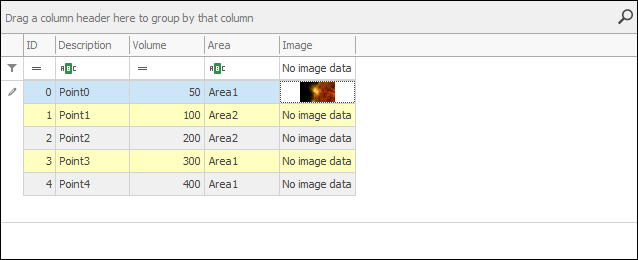
Click in one of the image fields and then right click to load an image:
❖In the Layer Data Grid you are also able to add a Calculated Column which is a column that dynamically calculates values according to some calculation you have specified for it:
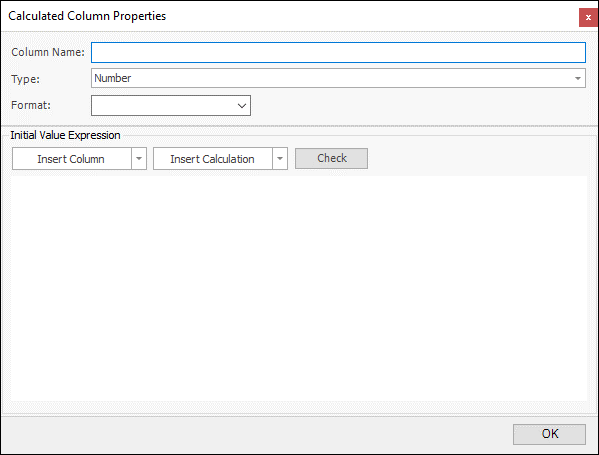
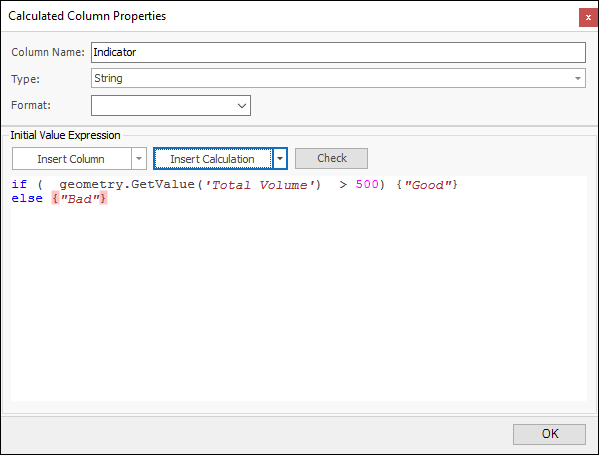
Type in the Column Name, Type and Format and then you can specify your expression below. Dropping down on Insert Column you can choose a column from the Layer Data Grid to insert in the expression to get values from, and dropping down on Insert Calculation you can insert a predefined calculation into the expression, these expressions use JavaScript:
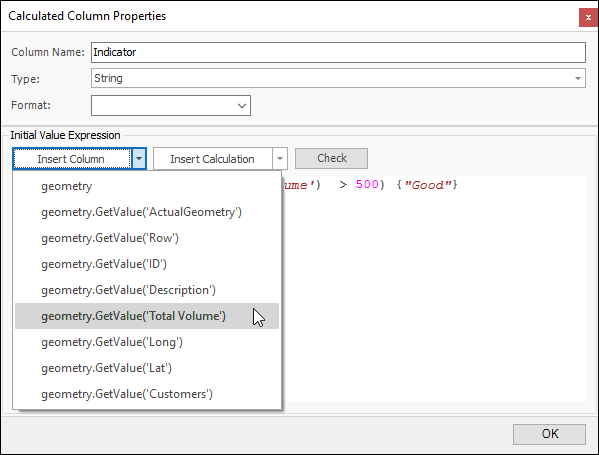
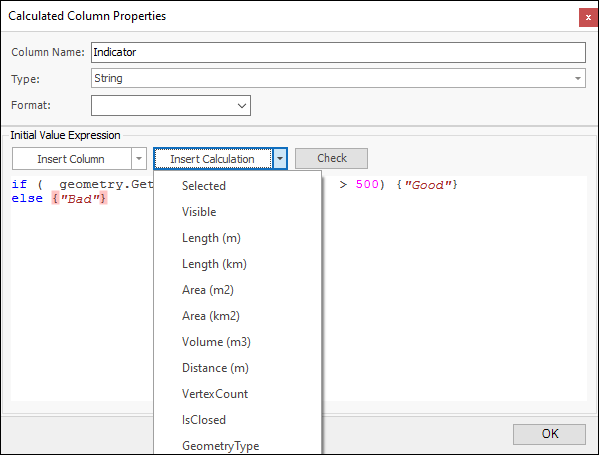
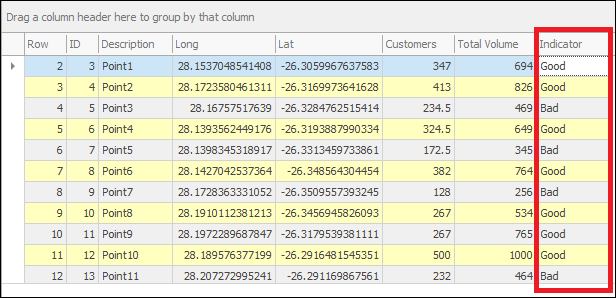
In this example you will see I have made a column called Indicator and the expression I have specified for it says if the value of the Total Volume column in my Layer Data Grid is greater than 500 then say “Good”, if not then say “Bad”:
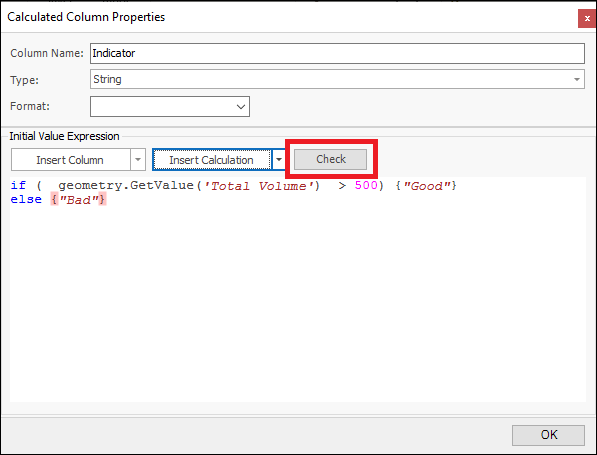
I can then click Check to see if this expression is correct and it will let me know:

I can then click OK on this and the dialogue and my calculated column has been added, any time the values in the Total Volume column are changed or any time a new row is added and a value for Total Volume is put this column will update accordingly:
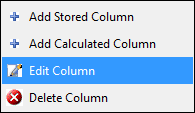
❖Edit Column will bring up a dialogue where you can edit the columns properties whether it is a calculated or stored column. This dialogue is the same dialogue you see in adding a new stored or calculated column (see section on Add Stored Column and Add Calculated Column to see how this dialogue works):

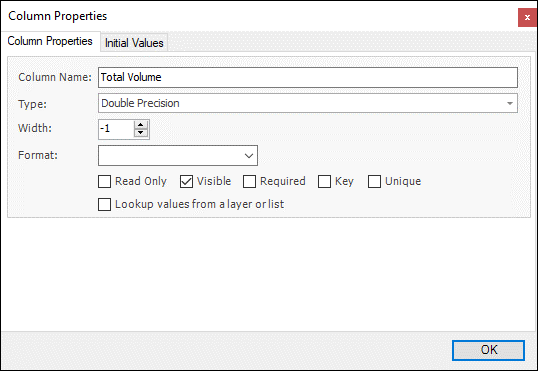
As an example of editing, if a column was read only and I wanted to change this I could tick off Read Only here.
❖To delete any column in the Layer Data Grid, click Delete Column (Note: if your column is set as a key column, you will not be able to delete it, unless you tick off Key in the Edit Column dialogue):
