Block Modelling Manual
❖In all our spatial products you are able to perform block modelling. This is basic block modelling, and for more advanced features such as kriging you would need EvaluationXL. The tool used to do this is called Grid Data:

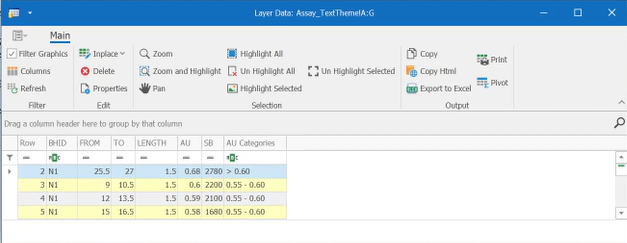
❖To demonstrate this tool, I will be using a layer with assayed values that have been surveyed down boreholes, if I view its data you will see it has segments with gold and tin values, they’re actually geometries generated because we did a borehole de-survey to get this but these can be any spatial objects as long as they have a value and dimensions:
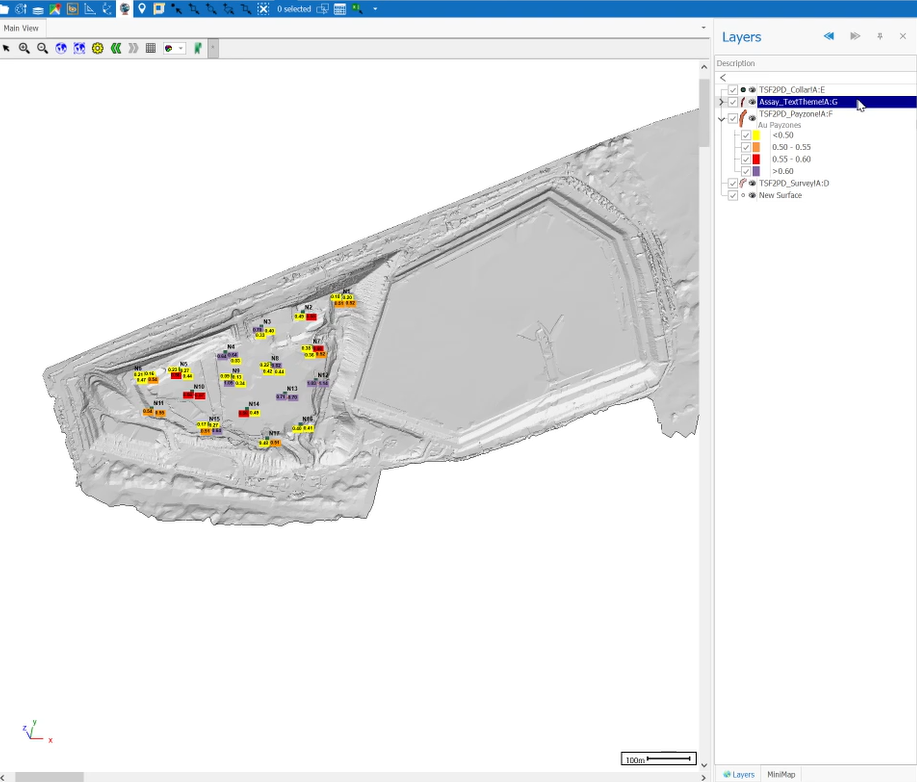
❖Clicking on Grid Data brings up the following dialogue:
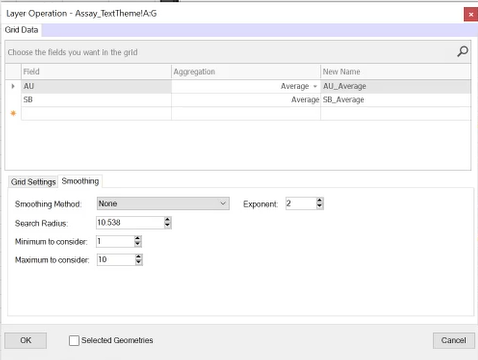
❖First, you choose the fields you want aggregated in the grid. It will do the aggregation in two steps: first it takes the geometries with their values and aggregates them straight into grid blocks, then after that you can do a smoothing operation with inverse distance weighting to smooth those blocks out. What I am choosing to aggregate here is the gold and tin grade and I am getting an average of this:
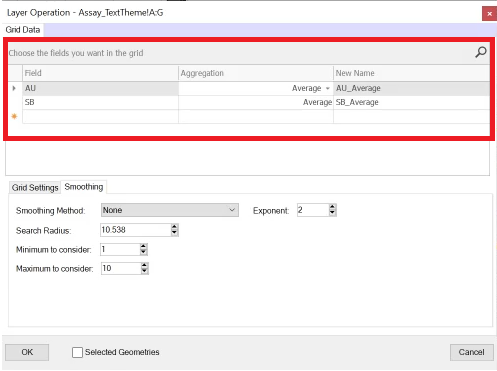
If you wanted to do more weighted averaging you could add a calculated column in the layer data grid and make it contain the content and use that column to do the calculations here (see Layer Data Grid Guide, Context Menus, Column Header Area Context Menu on how to add a calculated column).
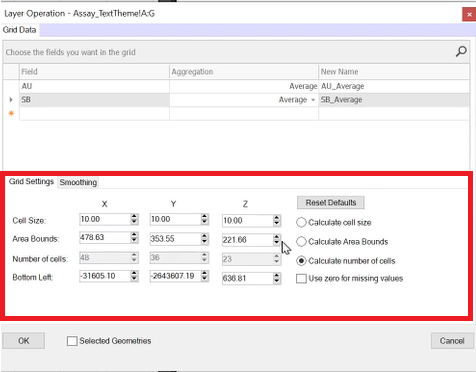
❖Now we can go into Grid Settings and as you will see it automatically calculates the extents of your data for you, you can choose to have the cell size, area bounds or number of cells calculated and then edit the other parameters, here I have chosen the number of cells to be calculated and then chosen 10x10x10 meter blocks and have left the other parameters to exactly fit the data, but I could’ve made the bottom left go a bit more out etc.:
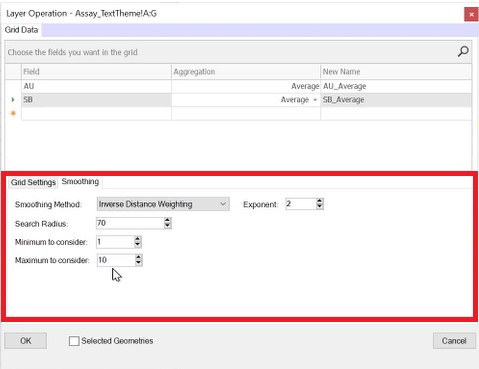
❖I can then go to Smoothing and choose the Smoothing Method, if it is none it will just do the aggregation to the block of whatever intersects that block, here I will choose the Inverse Distance Weighting option and I can then choose to what exponent, I will choose 2 here. I can then choose the Search Radius, it works out a default search radius of approximately 10% of the extent of your data, I want it to be more so I will make it 70. You can then choose the minimum and maximum number of elements to consider when smoothing and it will then take the closest and use those:
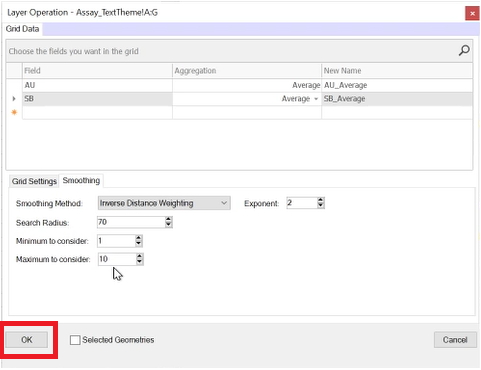
❖I’ve now set up my gridding and smoothing parameters and I am ready to compute so I will click OK:

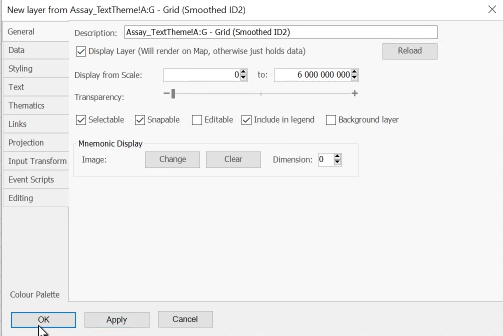
It then prompts me to set the settings of the new layer and I can the click OK:
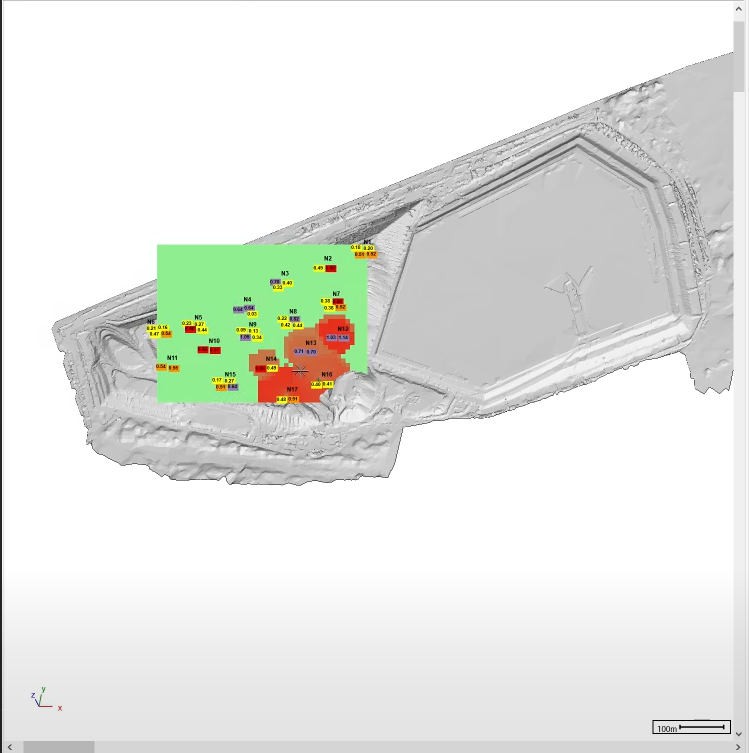
And there is my grid/block model:
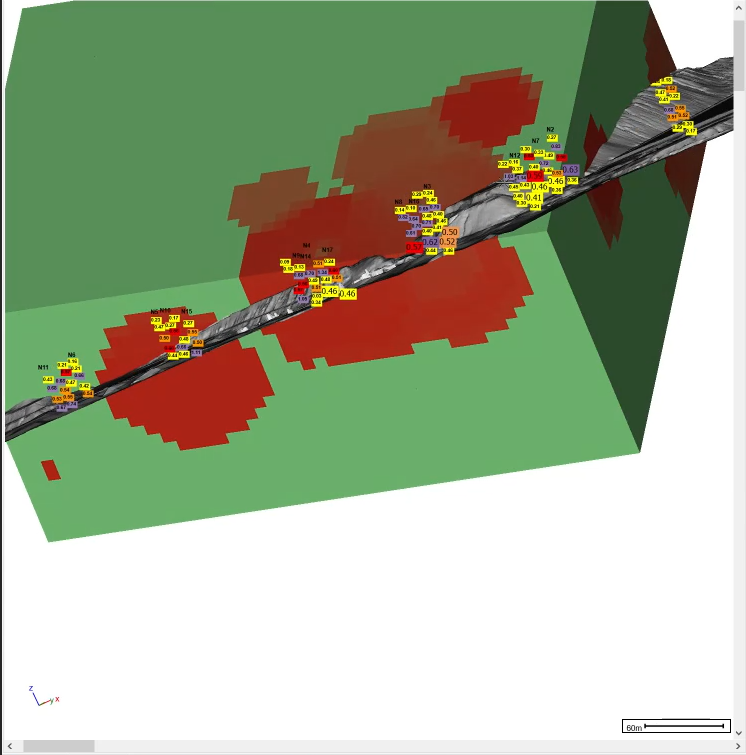
I can then zoom into it, snap to it using one of the snap tools and rotate it to see how it looks:
❖The default display for these grids is as a block model, it’s actually internally referred to and stored as a grid. What I can do now is put a thematic on it and colour it by the gold grade:
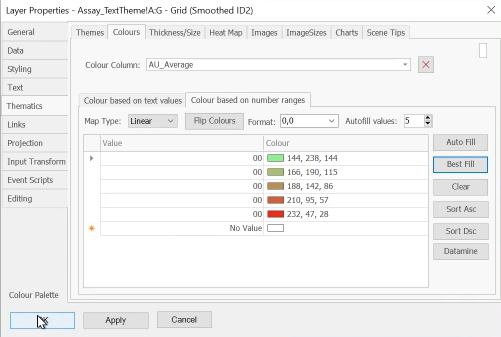
Now I can tick off the low values in the theme legend and only view the higher values if I wanted:
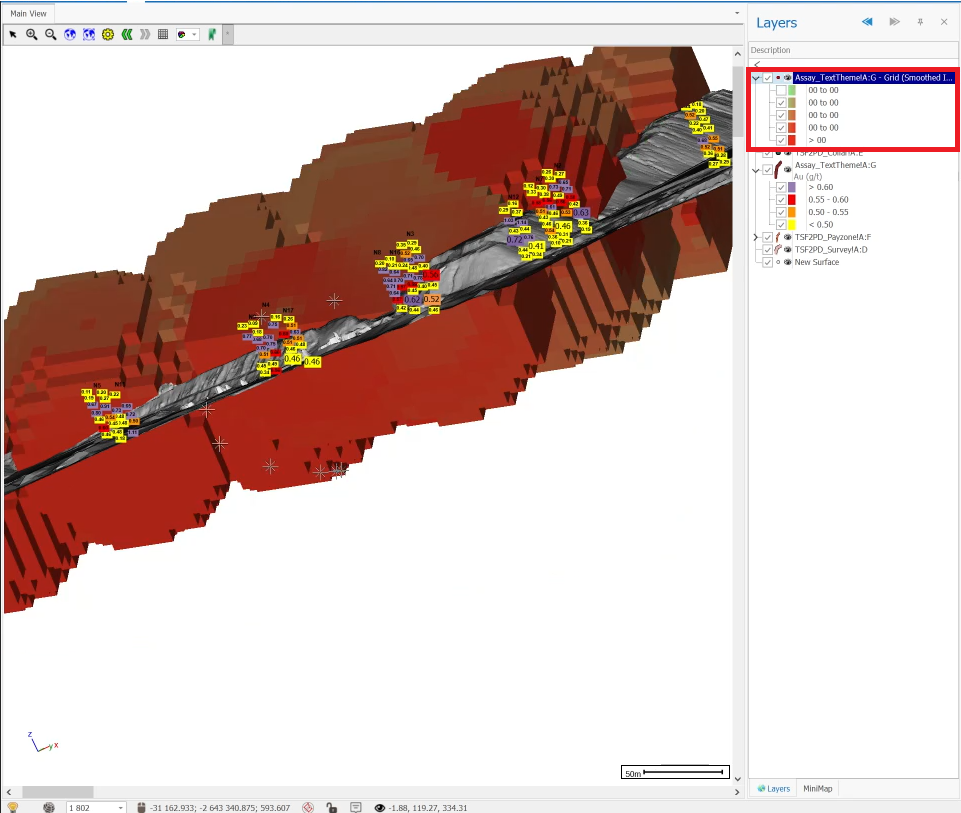
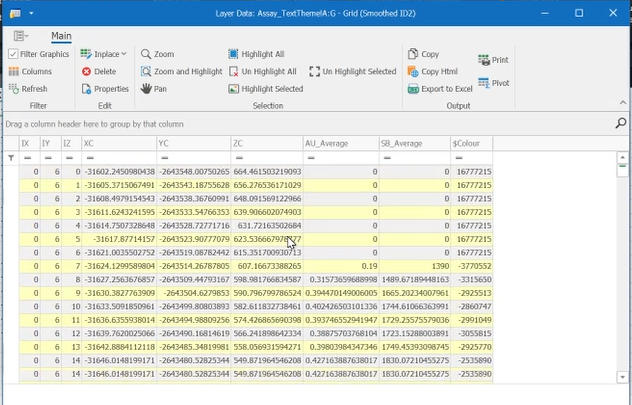
❖Now this block model we created is actually a grid file, you can view its data and it will appear as a typical table but it is actually a grid. You can then filter here in the layer data grid if you want as well:
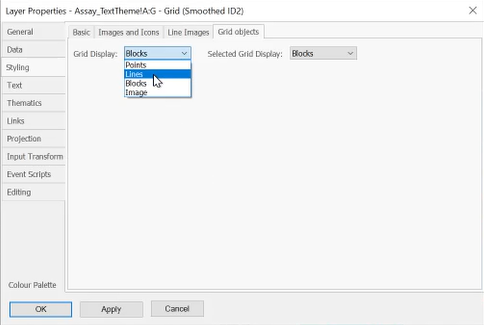
❖For grid objects there are special settings you can set in the layer properties under Grid Objects, you can choose to have the grid displayed as lines, points or blocks. You can also choose the selected display:
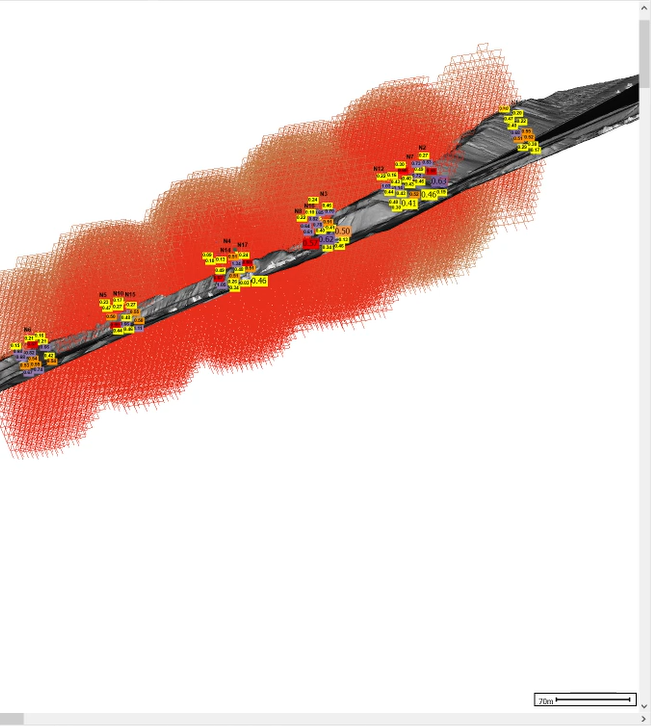
I will change it, for example, from block display to line display:
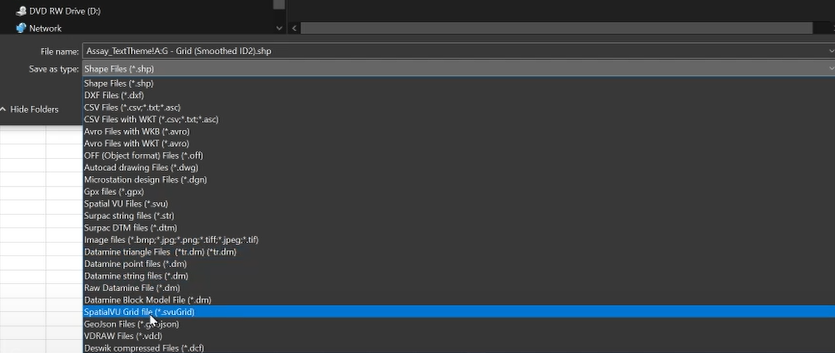
❖Now what you can do is save this block model by right clicking on the layer and doing the following:
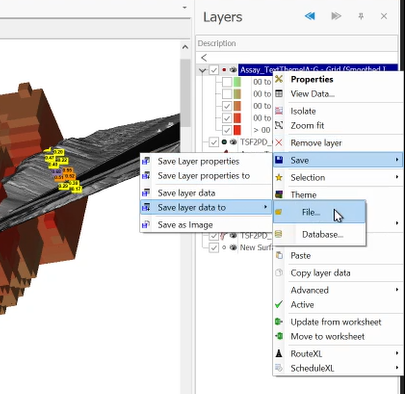
You can then choose to save it in our native file format for this which is SpatialVU Grid file(*.svuGrid), which is a very compact format, or any other format you would prefer for example a Datamine Block Model File(*dm):
