
Dynamic Aggregation
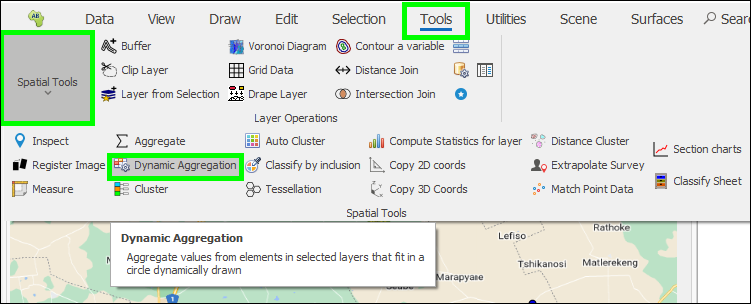
❖In all our spatial products you are able to aggregate elements from selected layers into a circle dynamically drawn. This tool is found in the Tools tab:
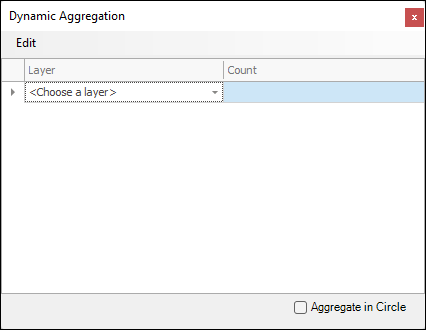
❖Clicking on the tool brings up the following dialogue:
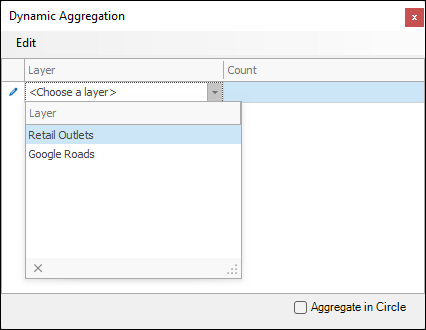
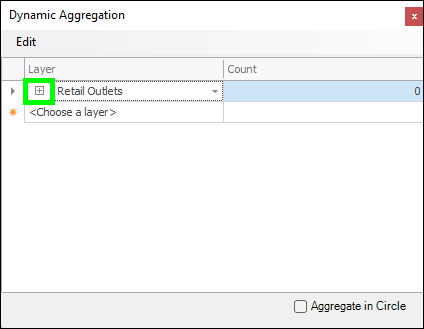
❖First, you will choose the layer or layers you want to get aggregations for, in this example I will choose just one layer, which is my Retail Outlets layer:
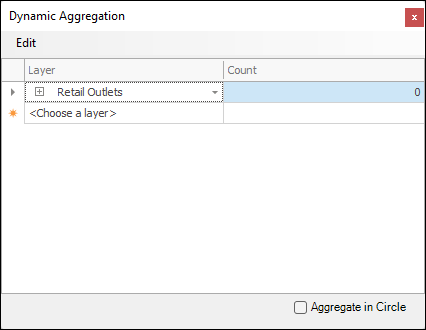
❖Under the Count column on the left is where a count of the number of items in that layer that fall within the circle you draw will be displayed. This is the first aggregation that is done for you. Open the little plus symbol next to the layer to specify further aggregations:
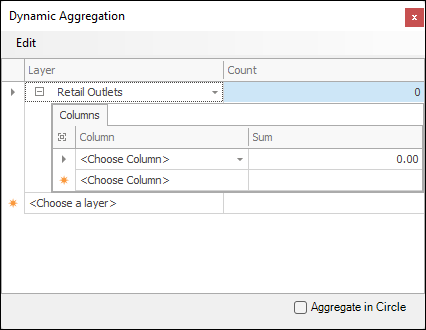
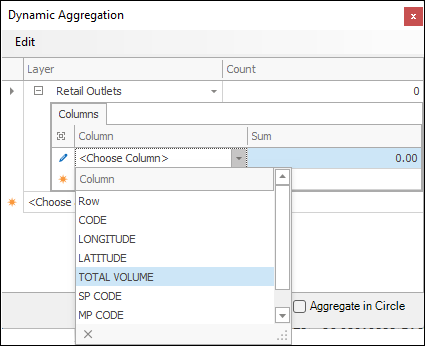
Here you can choose columns in your data that you would like to get a Sum aggregation of as the circle is drawn, in this example I will just be choosing one column to do this on, which is the TOTAL VOLUME column:
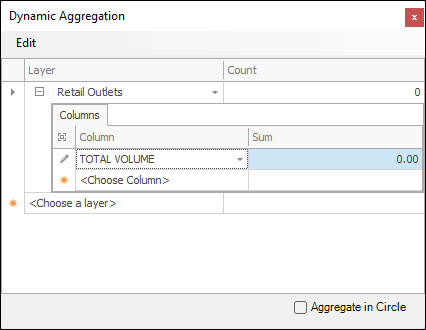
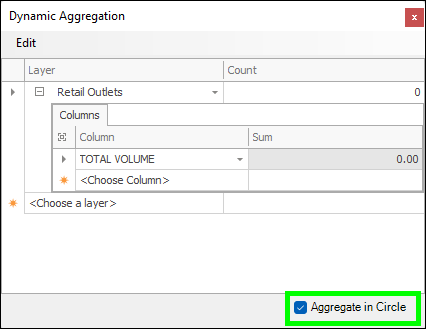
❖I am now ready to start drawing my circle, I then tick on Aggregate in Circle:
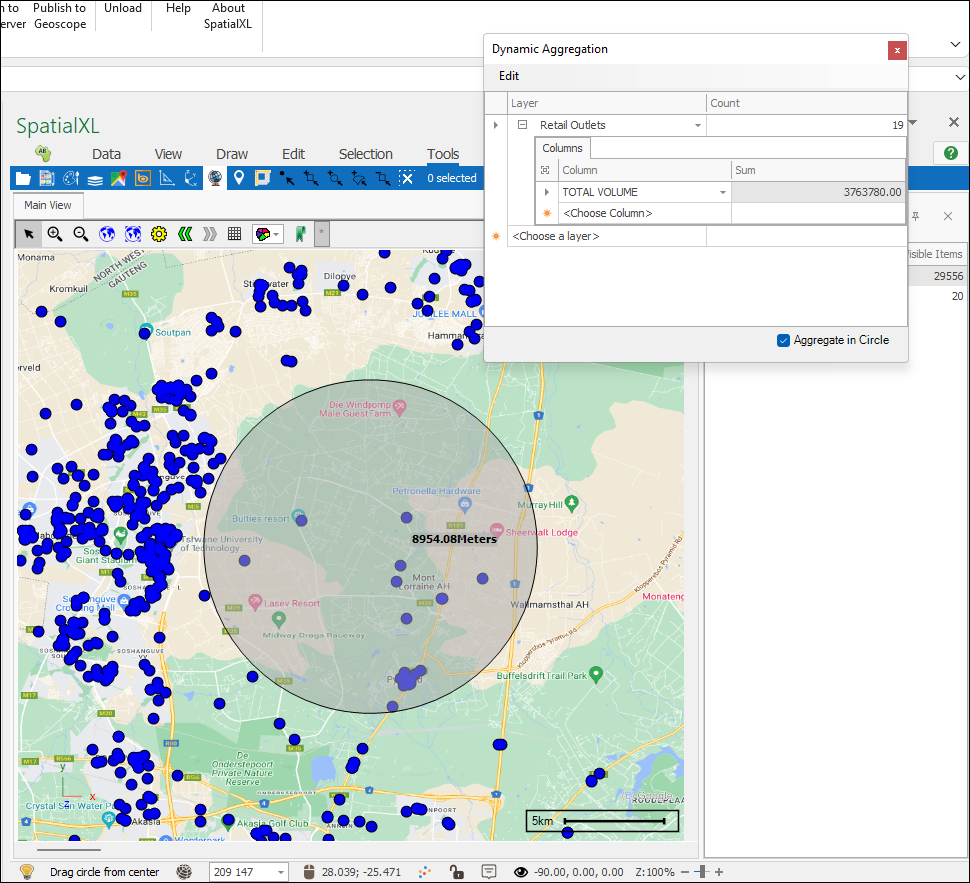
❖ In my scene I click and drag to start drawing. As I draw, the radius of my circle displays in meters and in the tool the number of outlets in that circle is aggregated for me under Count, and the Sum of the Total Volume of those outlets is aggregated for me as well. As I change the size of the circle these aggregated values dynamically change:
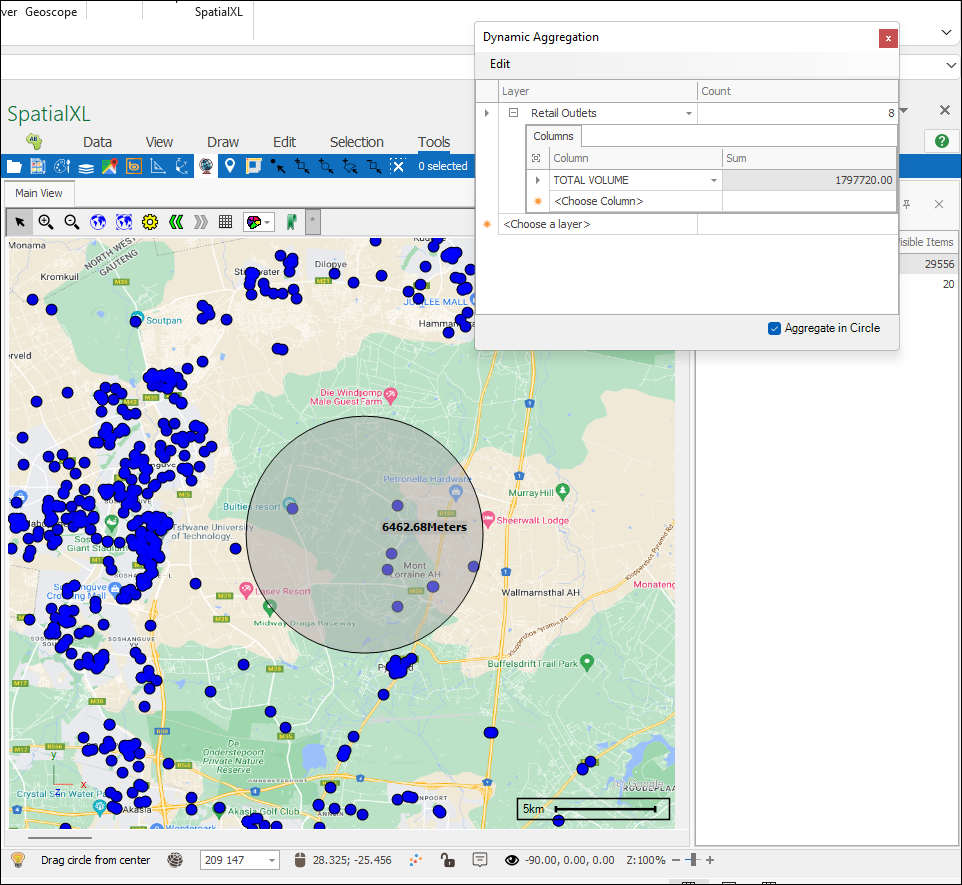
To stop drawing you simply release the click. You can move to other areas and keep dynamically drawing a circle and getting out the aggregated values under that circle.