
3D Capability in 2D Maps
❖In all our spatial products you are able to bring 3D into your 2D world for various analytic purposes. In this guide we will demonstrate an example of this.
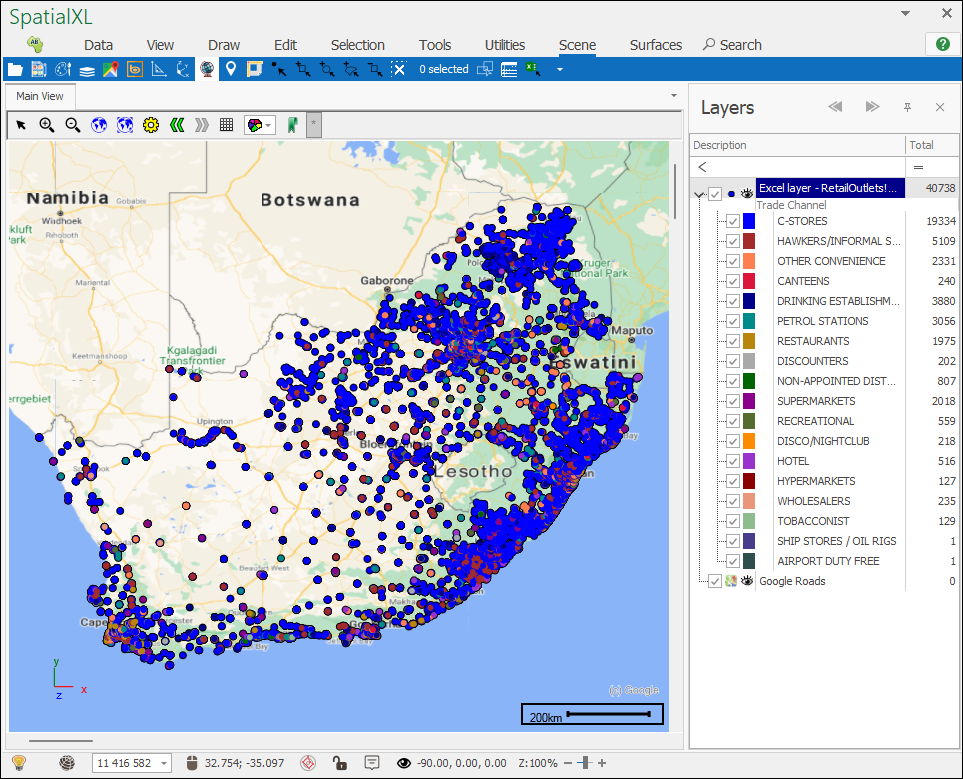
❖Here, I have a layer of retail outlets that I have added as a layer from an Excel spreadsheet in SpatialXL. These points display as 2D points on my map, and I can theme on them in various ways to do an analysis. As you can see here, I created a colour theme on the Trade Channel of the outlets:
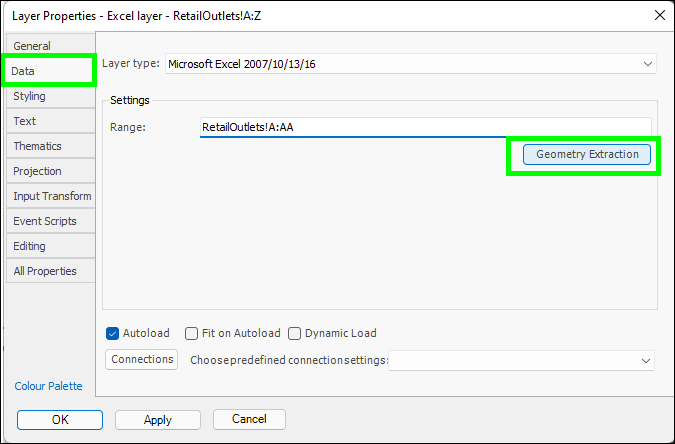
❖I can now add an additional dimension to this theme to see further data from these points. To do this I will use a Geometry Extraction which is simply a way of extracting the geometric data of my points to show them in a specific way; this is accessed in the Layer Properties under the Data tab. Right now, they just have a default geometry extraction which is as 2D points:
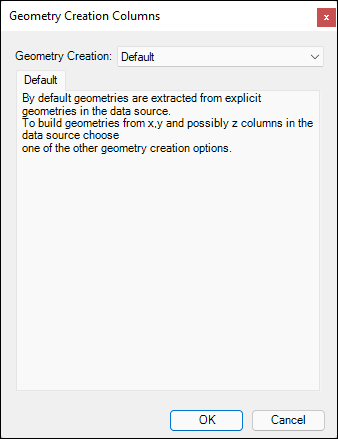
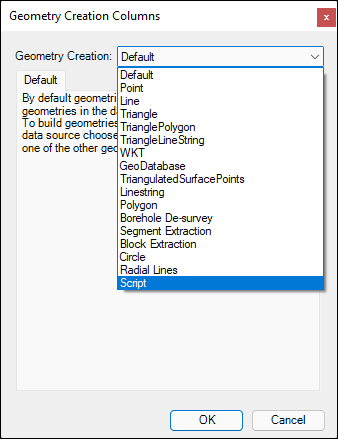
❖If I drop down on the Geometry Creation box you will see there are a number of different geometry extraction methods you can choose, we will choose the Script method:
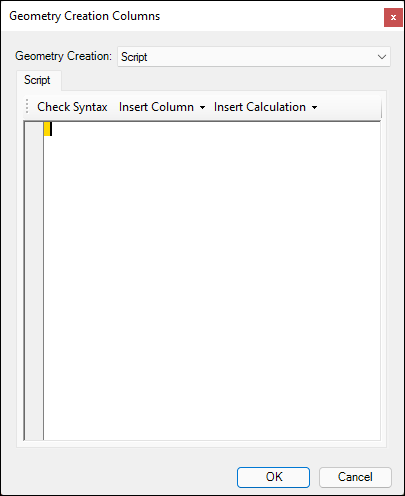
As you can see this brings up a scripting dialogue where we can specify a script that will say how the geometry should be extracted. There are some functions you can use here such as checking the syntax of your script (Check Syntax), inserting a column from your layer data into the script to refer to it (Insert Column), and inserting some predefined calculations (Insert Calculation).
❖I have now written a script that will cause the geometry of my points to be extracted as 3D cylinders going up from my map. The parameter I am using for the height of these cylinders is the value from the Total Volume column in my data for that point. In this way I will be able to see the Total volume of my points as a sort of bar graph that will come up from my map:
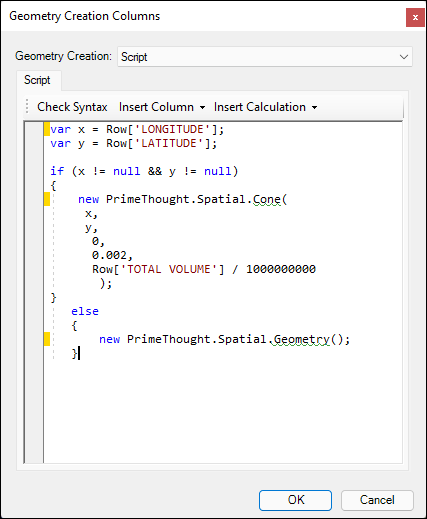
Here is a simple explanation of this script:
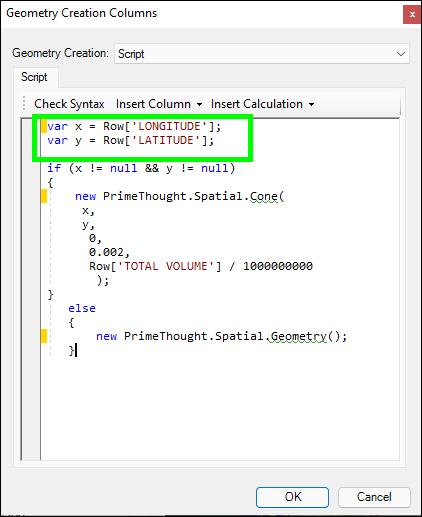
I created variables for the LONGITUDE and LATITUDE columns in my data since I will be referring to them a few times in my script.
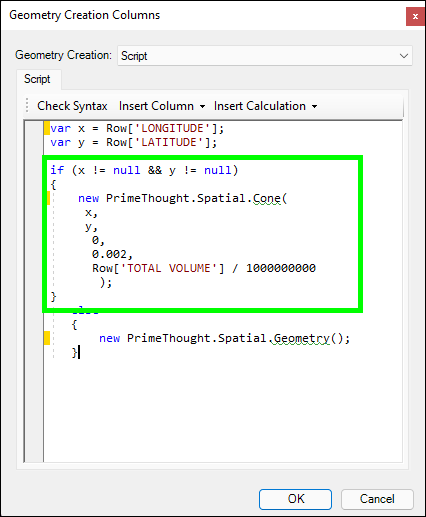
Then I said for the fields in these columns that don’t have a null value, create a Cone (cylinder) object ( if (x != null && y != null)
{new PrimeThought.Spatial.Cone) plotted at the coordinates of the point (x,y,0) and then set the radius of the cylinder in degrees (0.002), then set the height of the cylinder based on the TOTAL VOLUME column, also divide the values in this column by 1000 000 000(a number I chose based on the values in the column) so that the resulting height of the cylinder will not show too high (Row['TOTAL VOLUME'] / 1000000000).
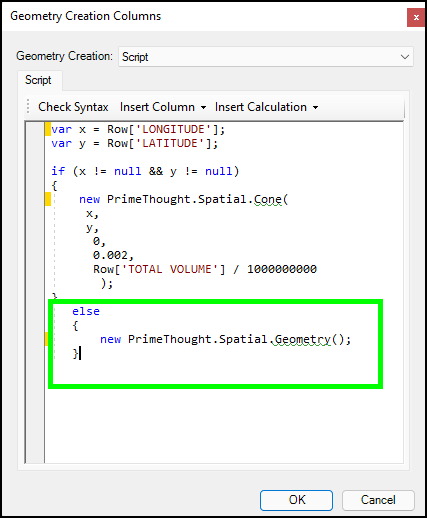
Finally return a blank geometry if there is a null in the longitude and latitude columns.
❖I can now click OK and then I will just create a new Theme for this called ‘Total Volume Cylinders’:
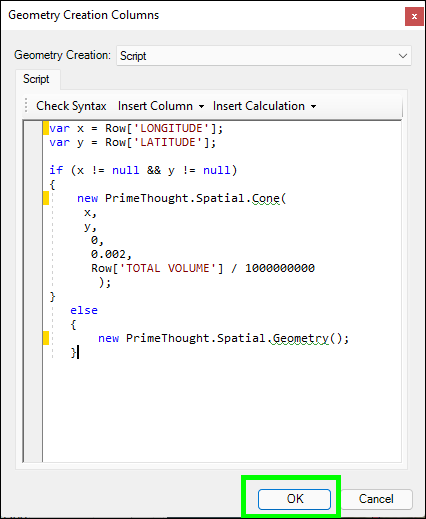
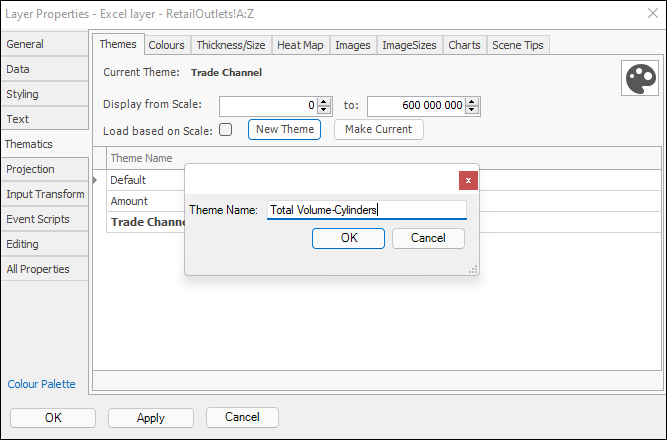
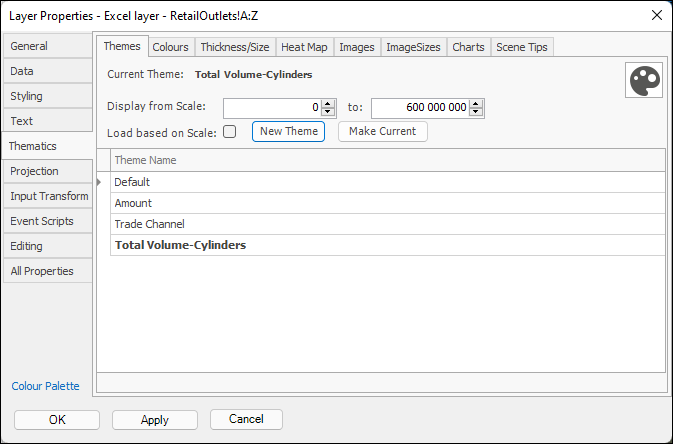
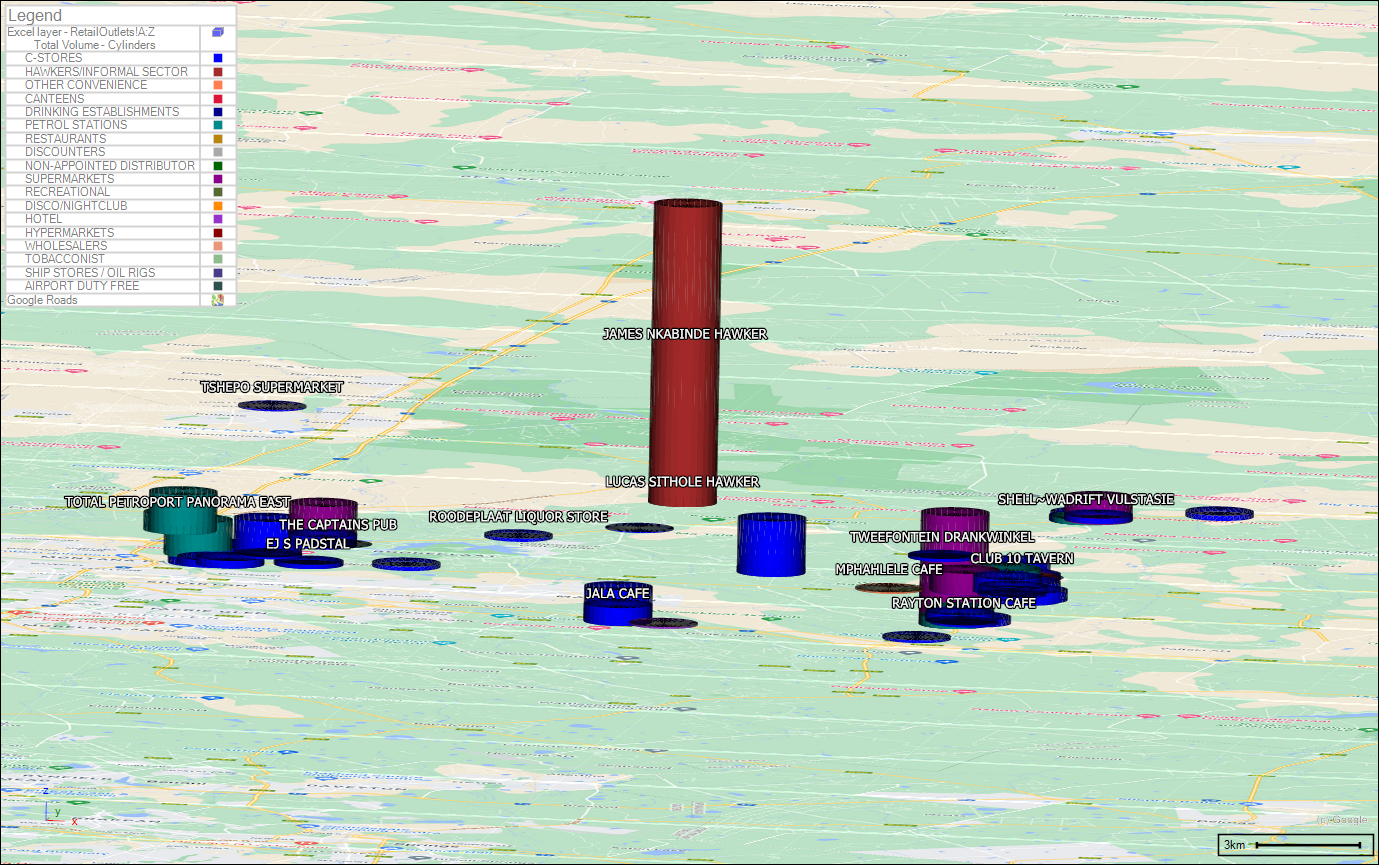
I will then click OK and the new theme is applied with my Trade Channel colours still showing and the points now extracted as cylinders. To see this clearly, I will zoom into an area and then hold down Shift as I left click and drag to rotate the map and view the cylinders:
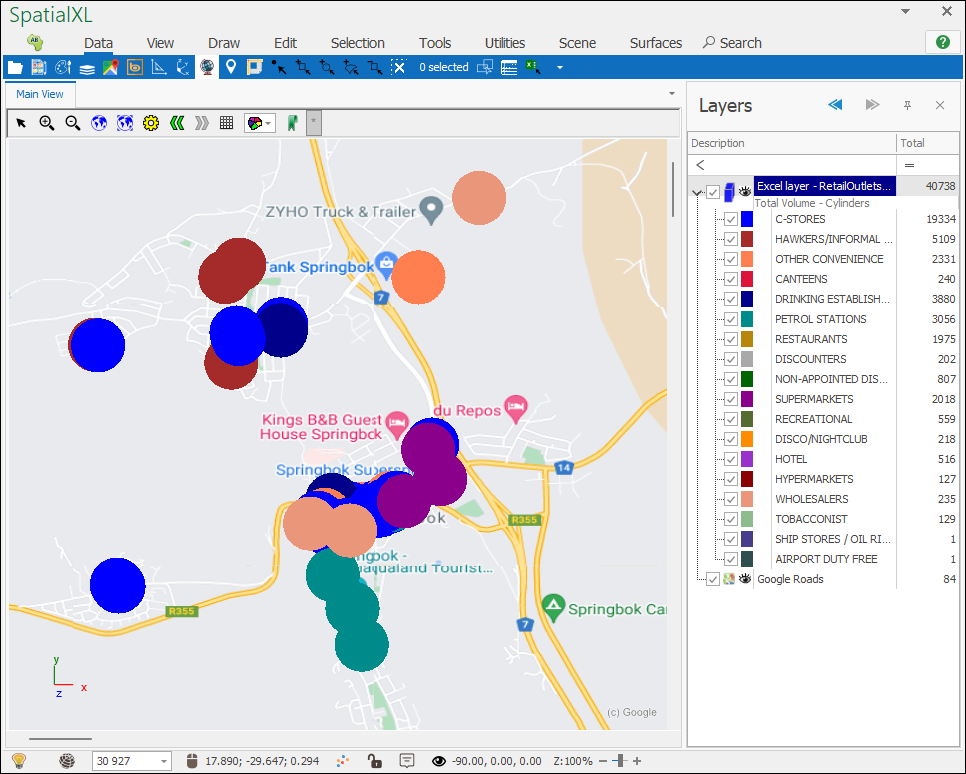
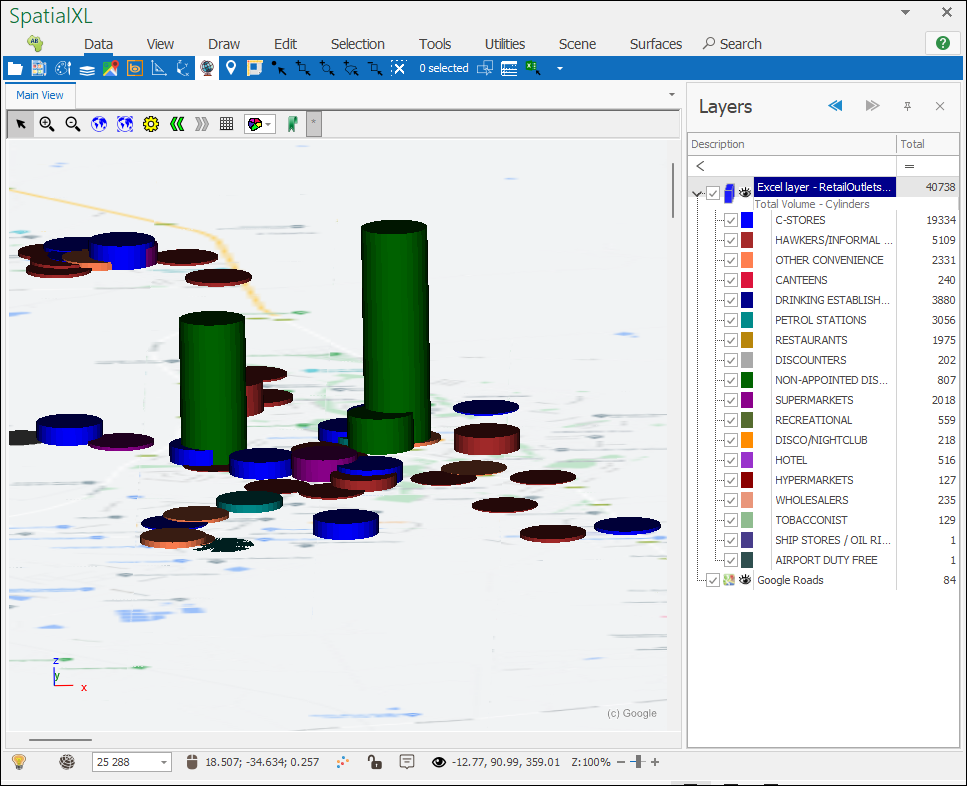
So I can now see the Trade Channel of each store and the Total Volume based on the height of each cylinder. I can then put a text label if I wanted to as well of the Total Volume of each point:
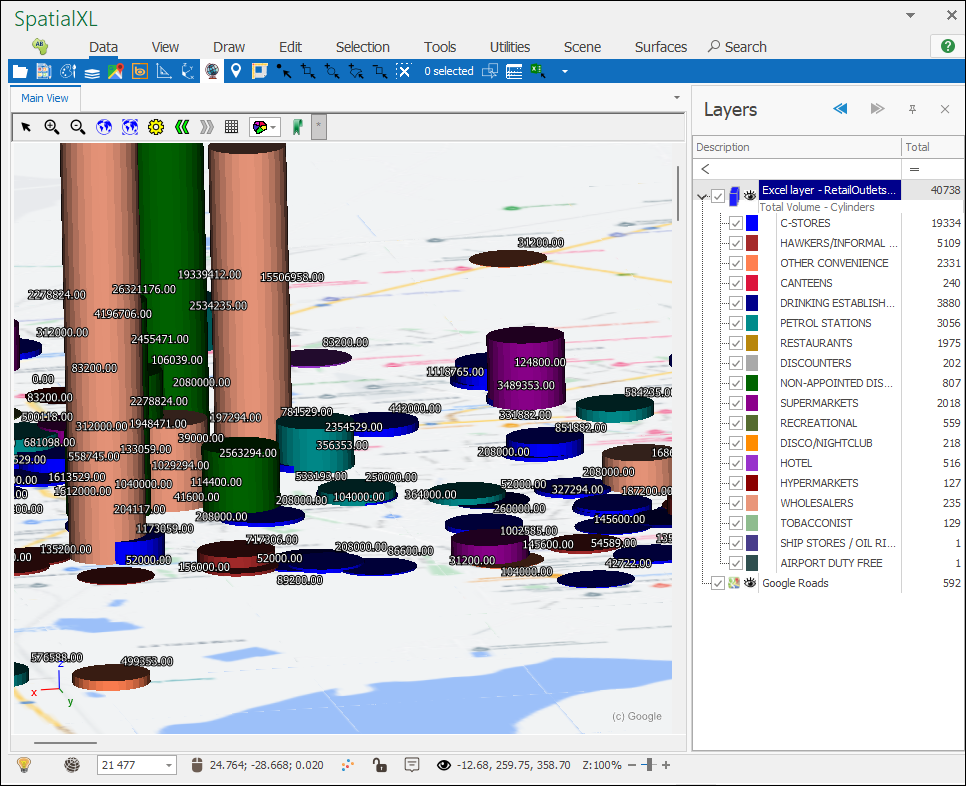
❖There are other types of script geometry extractions you can do such as one to extract points as linestrings going up and not cylinders:
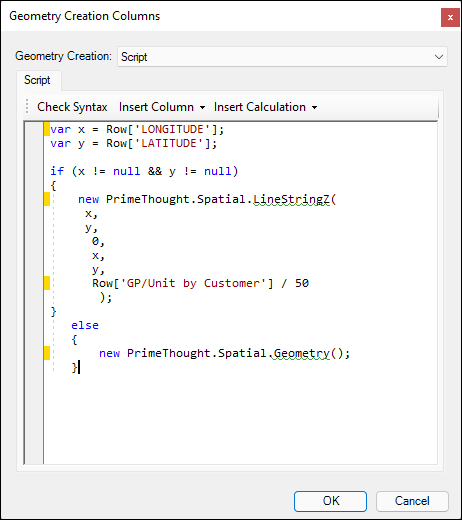
This script extracts points as linestrings with the height based on the values in the gross profit per unit (‘GP/UNIT by Customer’) column in my data. This is the result:
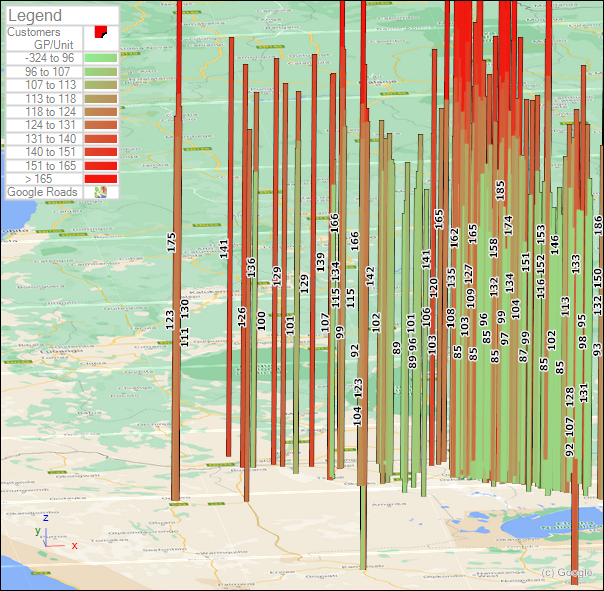
As you can see I also created a colour theme based on the same column to make the values in the GP/Unit by Customer column even more clear. I also put text labels of this.
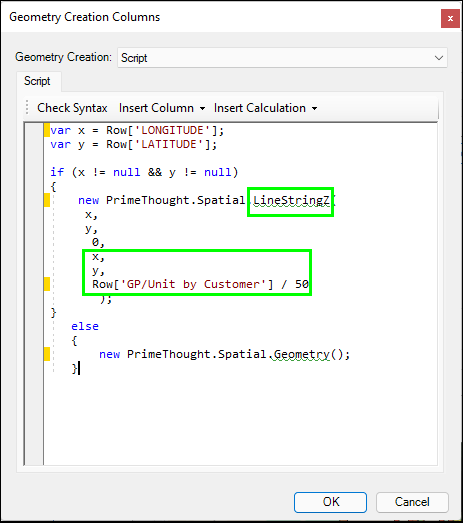
❖The only difference with this script is that I chose a LineStringZ object instead of a Cone and then specified the length and width of the linestring to be the same as the original coordinates (x,y) but the height (the Z value) to be based on the GP/Unit by Customer column in my data divided by 50 so that the height is not too high:
❖There are many other types of scripts that can be written to extract your geometry by, and if you want to extract as a different type of geometry to the ones mentioned so far, intelligent code completion will bring up all available objects after ‘PrimeThought.Spatial.__’. Furthermore if you do not want to create these scripts yourself or if you can’t, we can create them for you on an ad hoc basis.
(For more data on how scripting works in our products refer to the Scripting in Spatial Studio guide.)