
RouteXL
RouteXL is an add-in to SpatialXL that allows optimised routing, transportation scheduling and high-speed bulk routing operations.

Drive Polygons

How to set up your data
❖Load your Routing Network by browsing to your .routingDB file. Your Routing Network will be displayed in the bottom right corner of your RouteXL window. I loaded newzafza.routingDB which is the South African Routing Network.
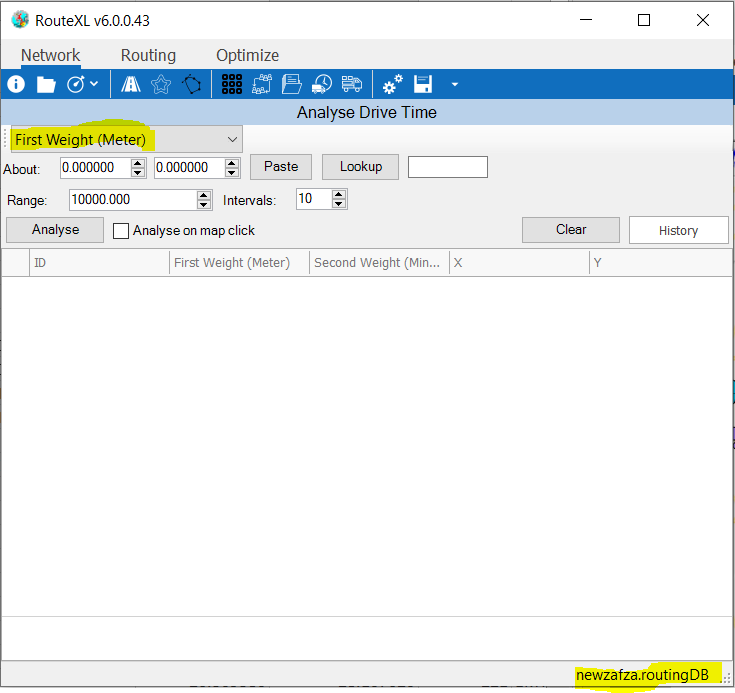
❖You can either draw Drive Polygons using First Weight (Meter) or Second Weight (Minute). I have chosen First Weight (Meter) in this example.
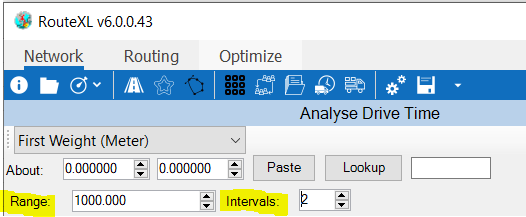
❖In this example I am setting the Range of the polygon to be drawn 1000m about an area/s. (If Second Weight (Minute) is chosen the range type would now be in minutes and not meters)
I also chose 2 Intervals. This means the Drive Polygon/s will be drawn in 2 levels to make up 1000m – 500m and 500m.
Inputting your data

❖There are different ways that you can draw Drive Polygons.
1.Copy and Paste your coordinates here of an area you would like to draw a Drive Polygon about.
You will see that when you Paste your coordinates a Lookup value is inserted. This is just the Node ID of the South African Routing Network.
On your map, the Drive Polygon will be drawn as above. A layer has also been added – Drive Time Analysis.

2.You can Analyse on map click. Tick this on.

For every click you make on the scene, a Drive Polygon will be drawn per your settings.
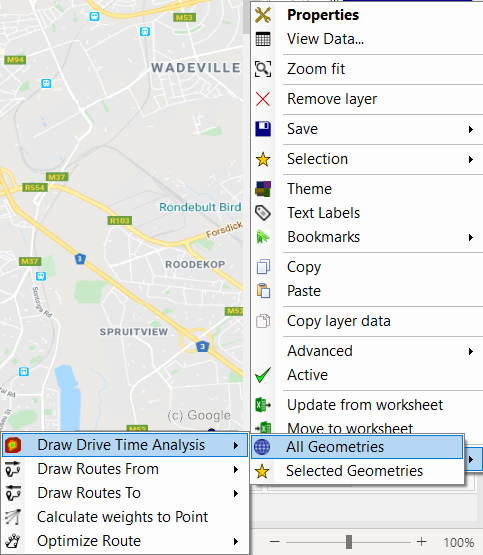
3.You can draw Drive polygons around All Geometries of your layer or Selected Geometries. I am using All Geometries in this example.
Ensure that you first set up your Weight, Range, and Intervals.
Right click the layer that you will be doing this exercise for. Select RouteXL > Draw Drive Time Analysis > All Geometries (If you are using Selected Geometries, ensure your points/geometries are first selected on your map.)
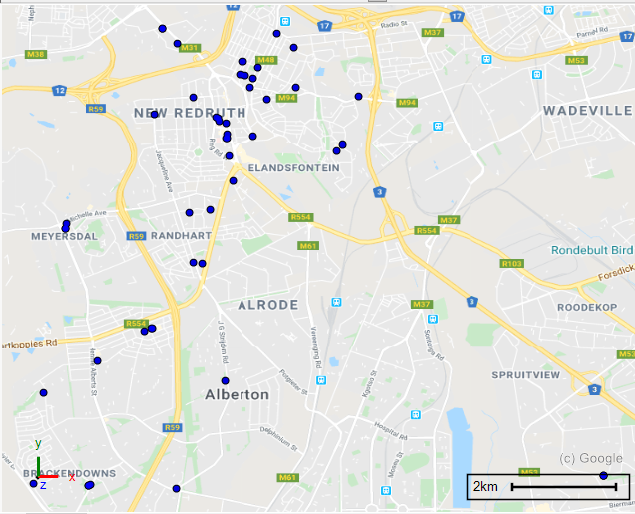
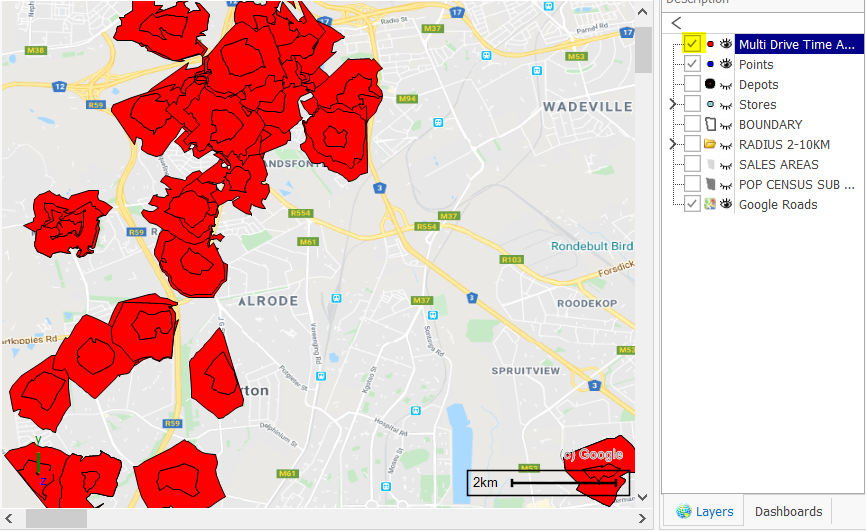
All geometries/points now have Drive Polygons per our settings. A layer Multi Drive Time Analysis has also been added.
Understanding your data
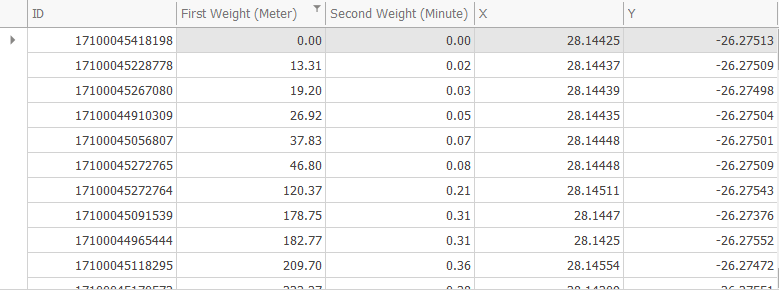
❖Whether you Analyse on map click or copy and paste coordinates, your RouteXL window will be populated with this data of your Drive Polygon/s.
The ID column are your Node IDs in your Routing Network.

❖Analysed Drive Times in 06ms indicates how long it took to analyse the drive times/distances. It took 6 milliseconds in this example of analysing 2 Drive Polygons I created by Analysing on map click.
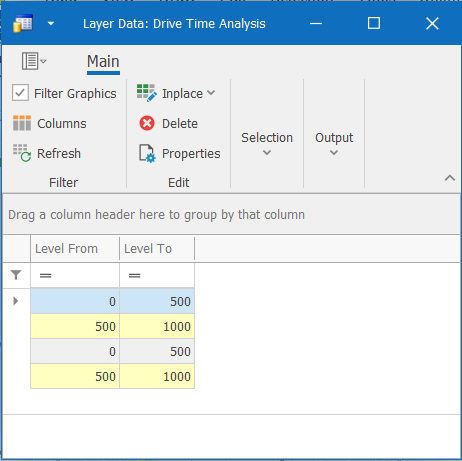
❖In your Drive Time Analysis layer that was created you can view the 2 polygons data by viewing your Layer Data grid.

❖If you are drawing Drive Polygons on All Geometries or Selected Geometries – when the analysis is complete it will show at the bottom of your RouteXL window – Completed 98 contours.
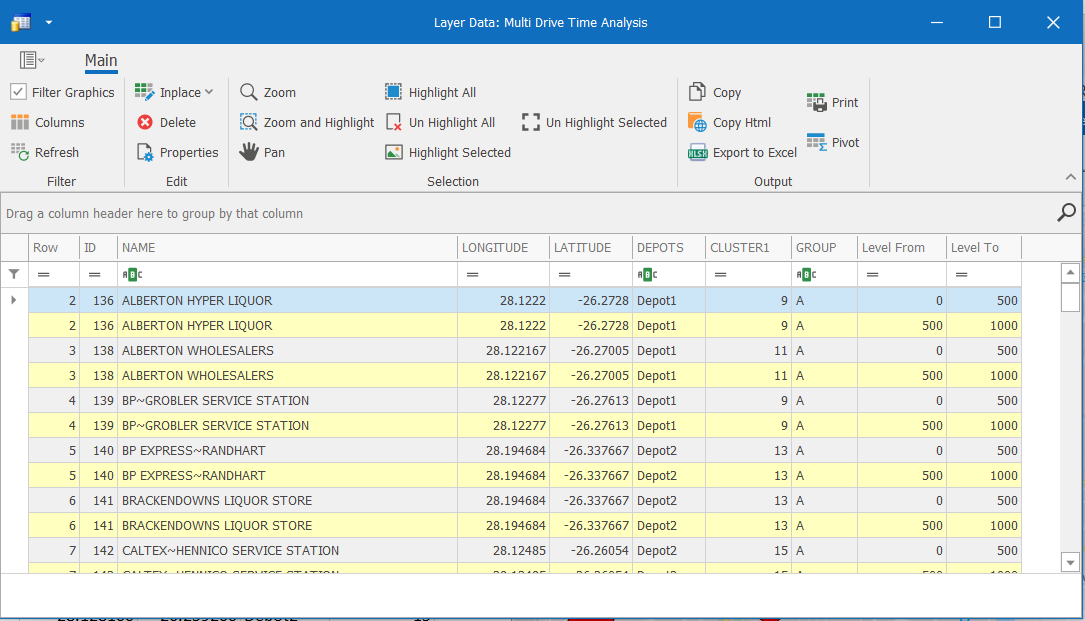
❖View your Layer Data grid of the layer Multi Drive Time Analysis that was created in this instance.
❖If you need to clear your data in your RouteXL window and start afresh, click on Clear.

❖If you want to view the history of Drive Polygons you have created, click History. Click it again to remove it.
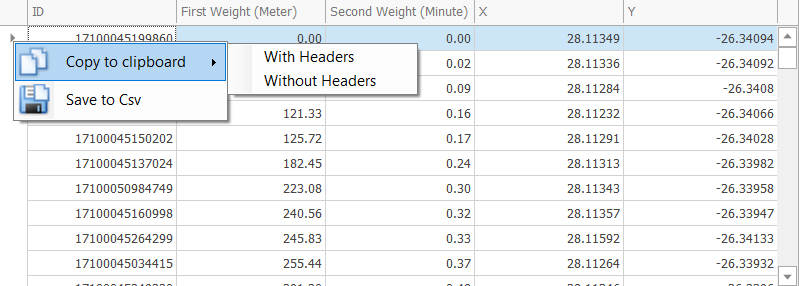
❖The data in your RouteXL window can be copied out by selecting row/s or saved to a CSV file for further analysis.
Support
|
||||||
|
T: +27871354351
|
|||||
