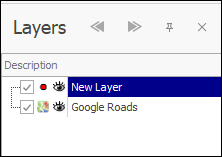
❖You can view a pivot of your layer data by clicking on Pivot Data (first make sure to have the desired layer selected in the Layers Description box), this will bring up the Pivot dialogue where you can design your pivot and do various other things with it:

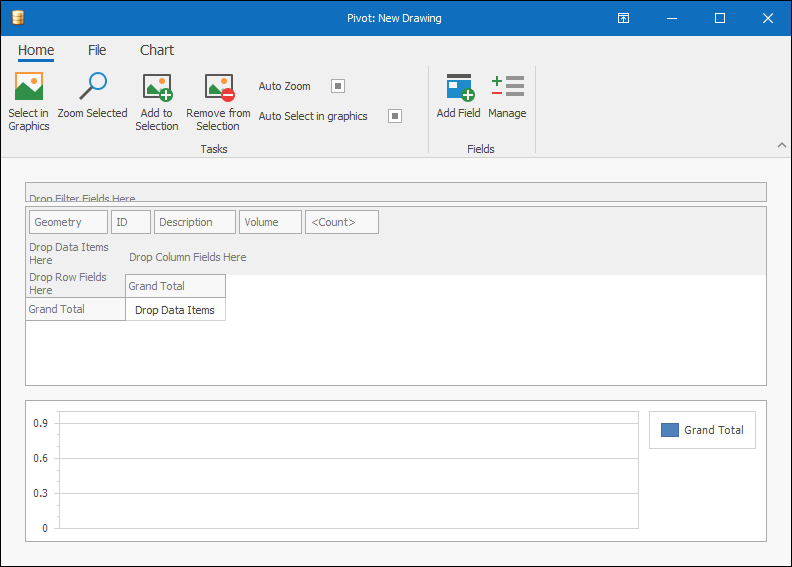
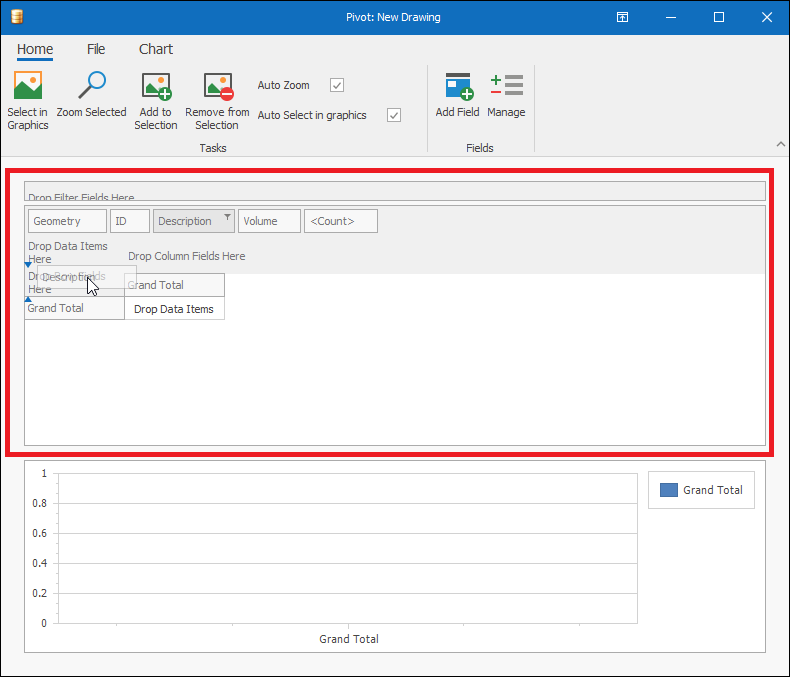
To create your pivot, drag and drop the fields of your data to be row, column or data fields:
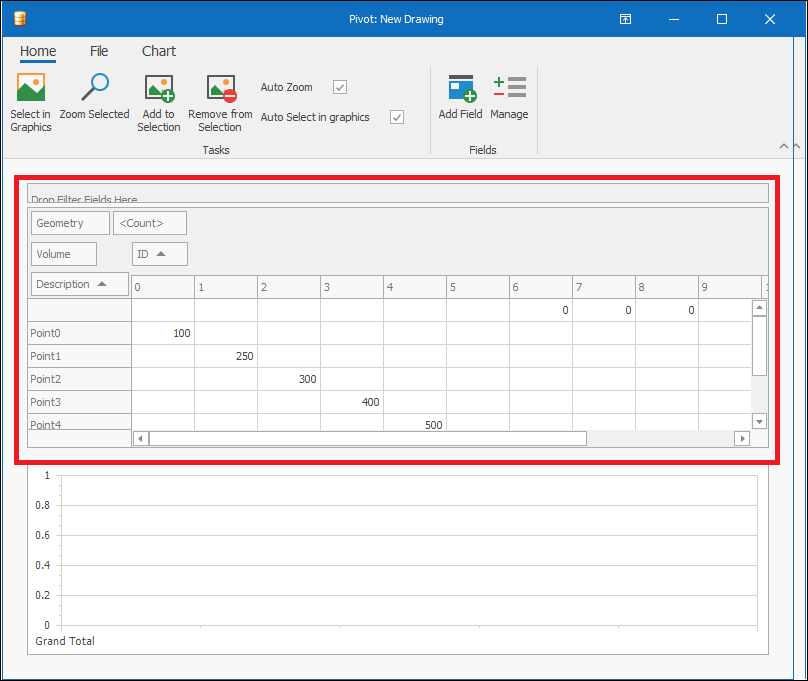
Hovering over any one of the column headers you will see a filter symbol which if you click on will allow you to do filters on that field:

Furthermore, clicking once on a column header will sort it ascending and twice will sort it descending, as indicated by an upwards or downwards arrow:

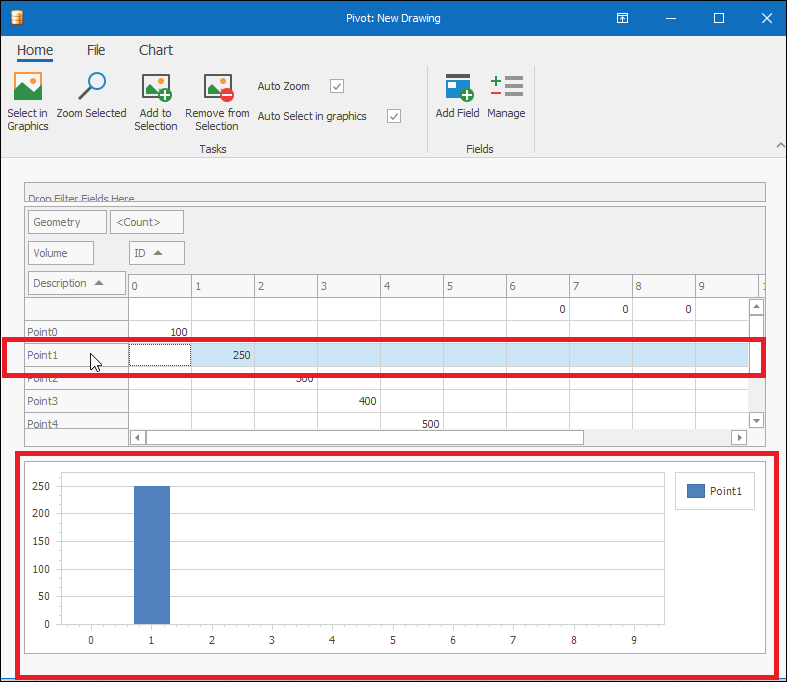
When you click on a row in the pivot, the chart below will display data for it:
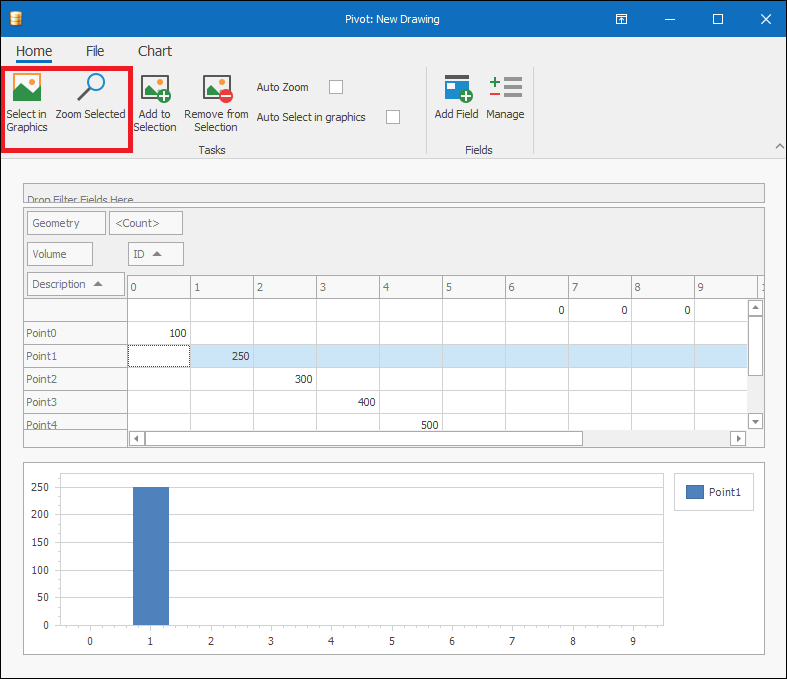
❖Once you have selected a row in your pivot you can highlight and/or zoom to that row in graphics by clicking Select in Graphics and/or Zoom Selected:
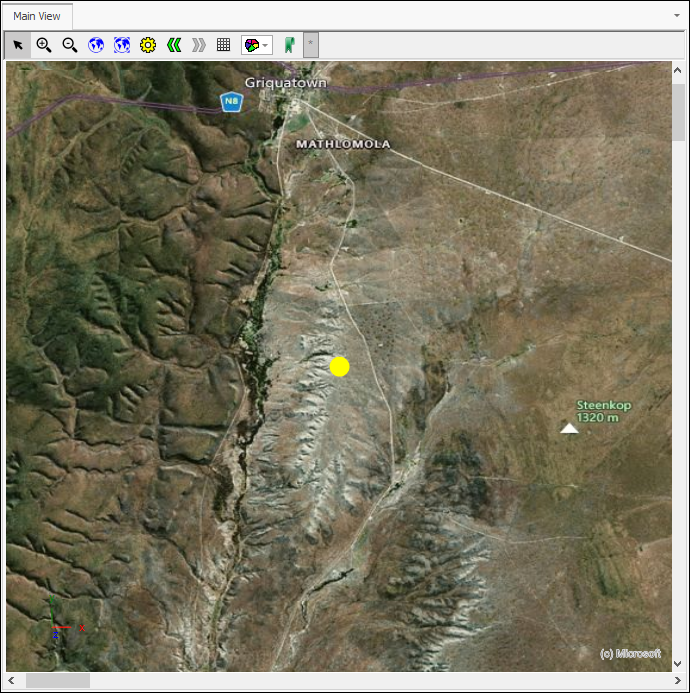
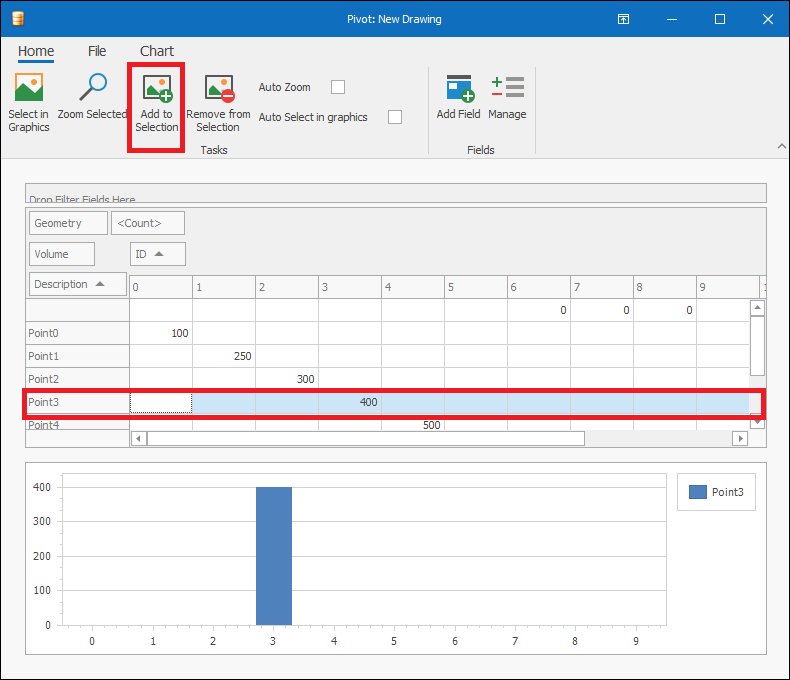
If you have already selected an element in graphics and you want to select another element and add that to the selection, select the row in your pivot and then click Add to Selection:
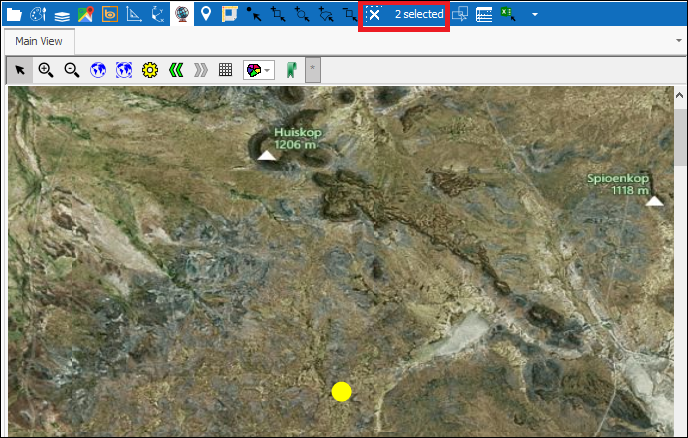
To remove an element from selection, select the row in your pivot and then click Remove from Selection:

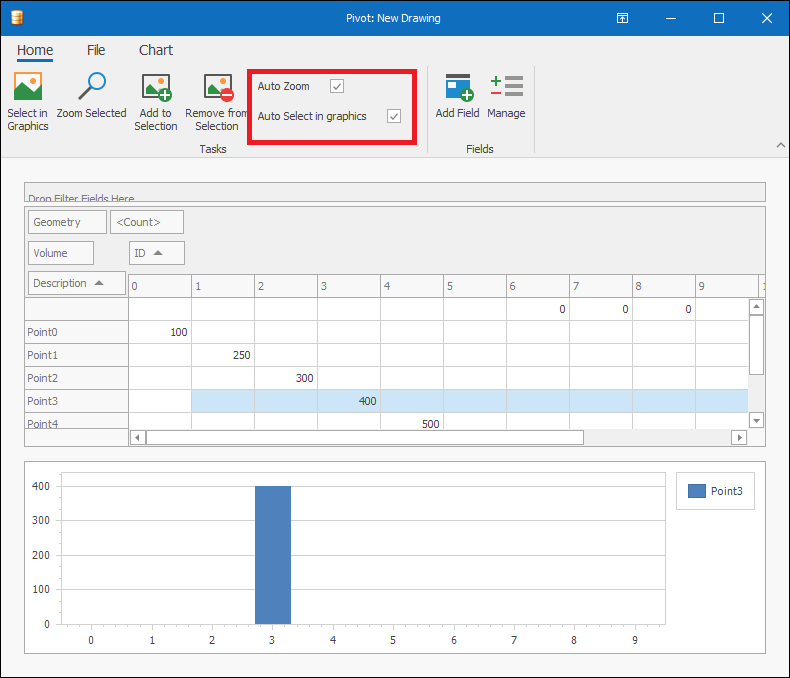
If you want rows to be automatically selected and/or zoomed to in graphics when you click on them, tick on Auto Zoom and/or Auto Select in graphics:
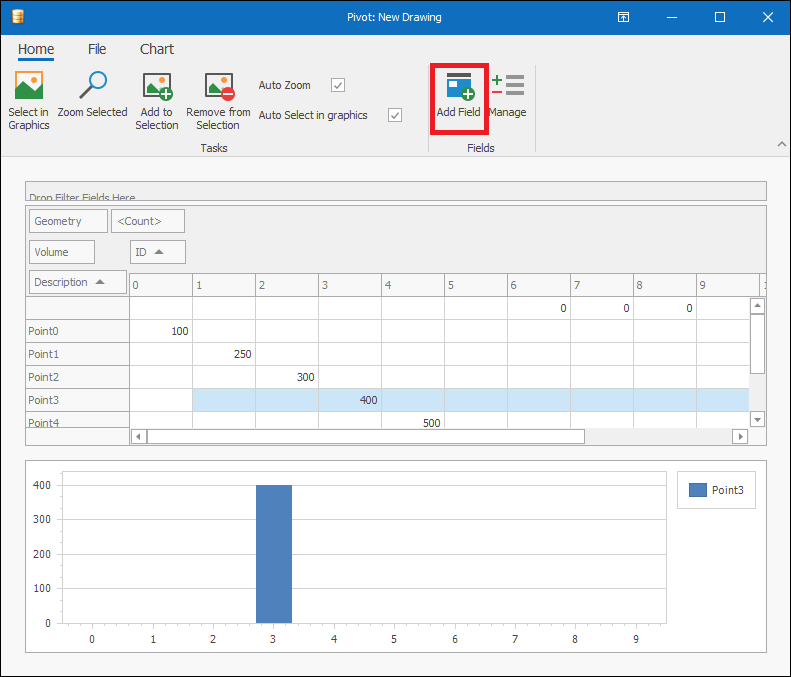
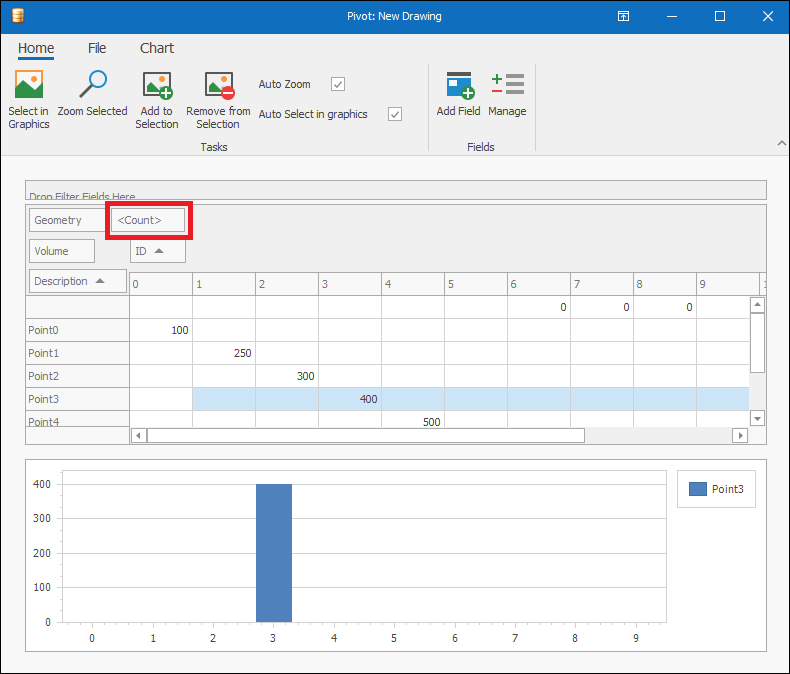
❖Clicking on Add Field you can add additional fields to your pivot, for example here I can add a Count field:
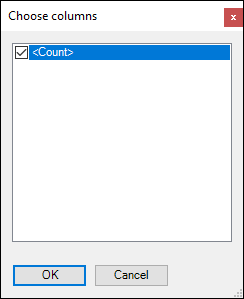
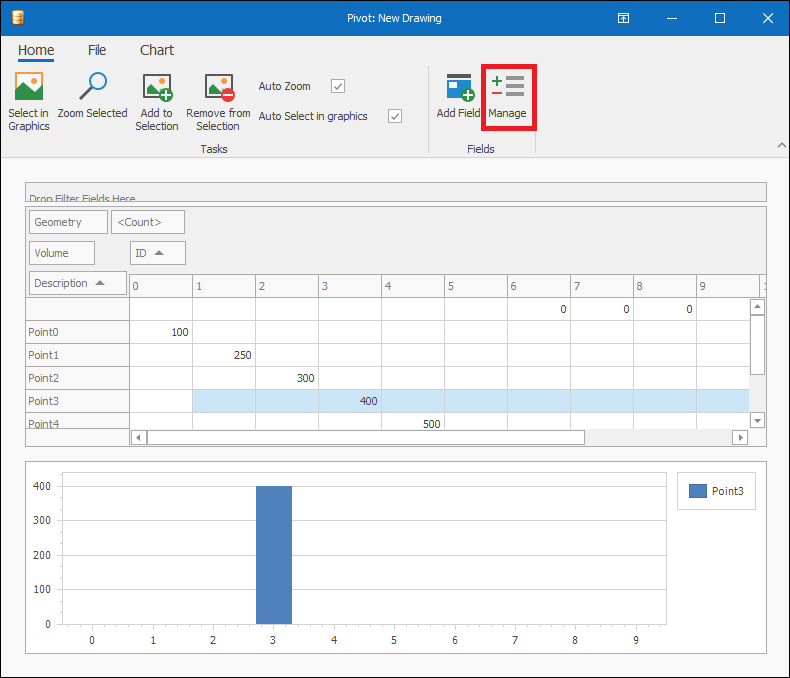
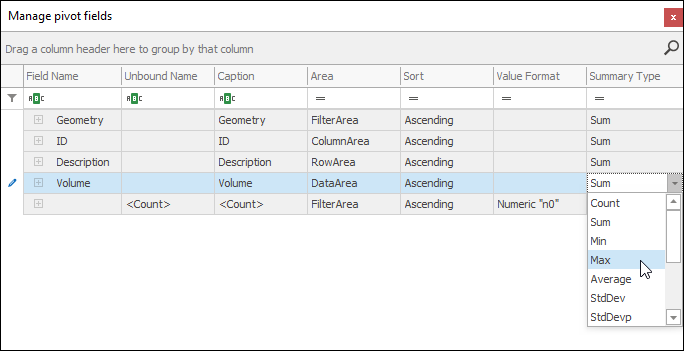
❖To manage your fields click Manage and this will bring up the Manage Field dialogue where you can edit things about your fields for example whether you want a Sum or Max etc. to be done:
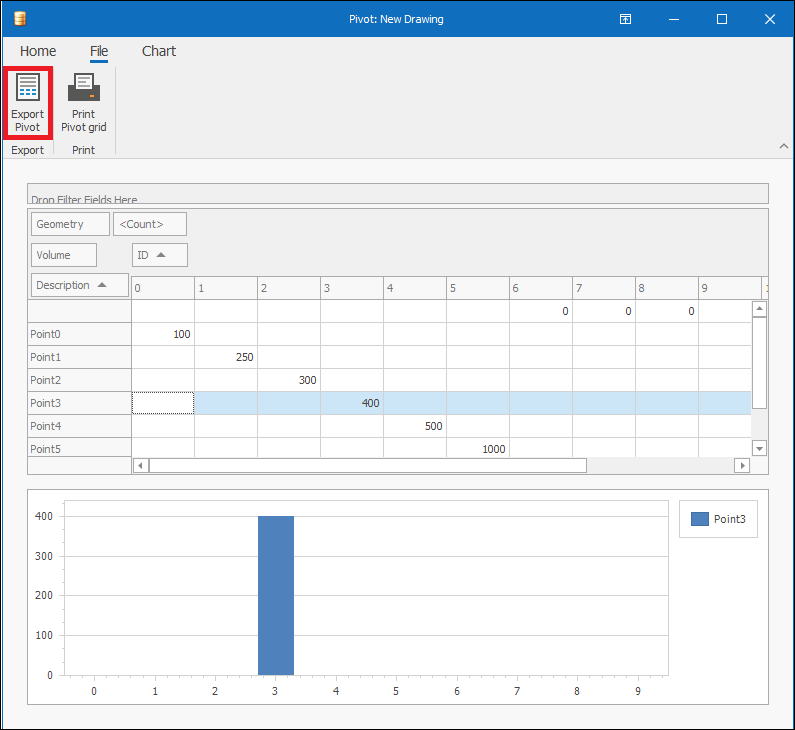
❖In the File tab you can export the pivot as a CSV or Excel file by clicking Export Pivot:

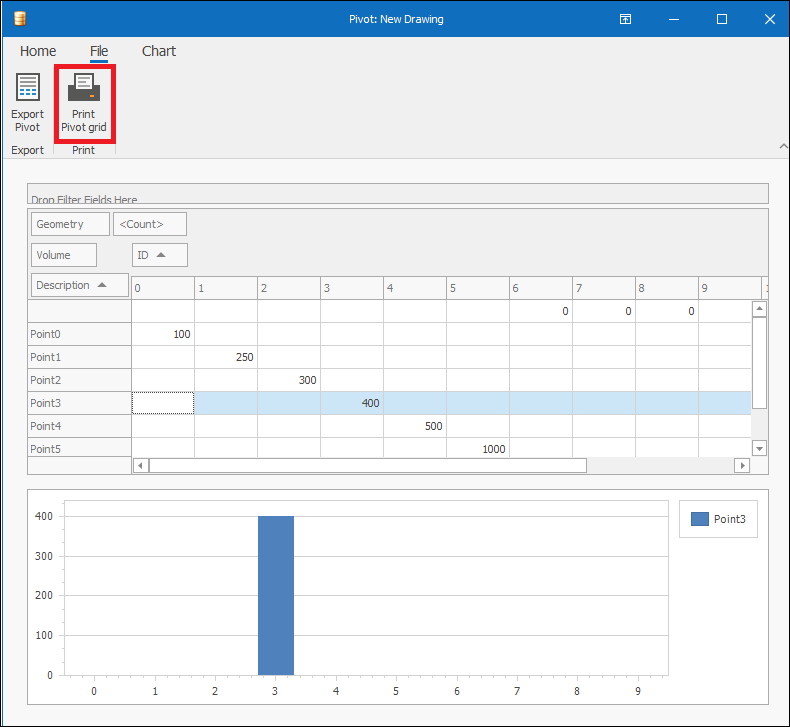
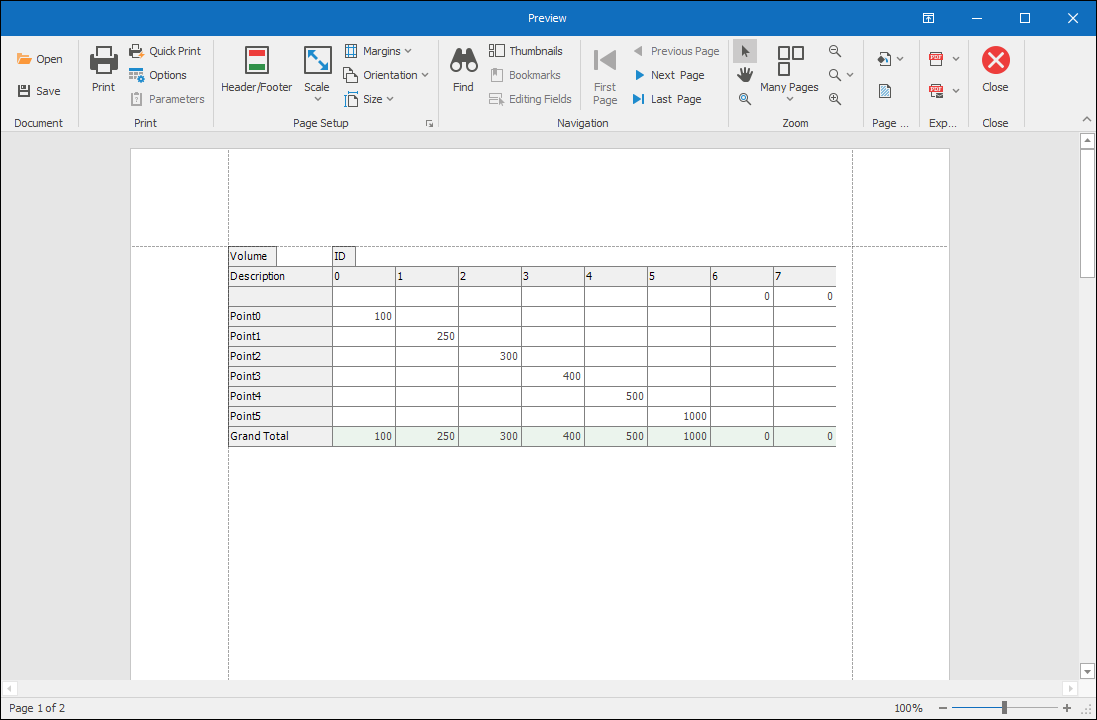
You can also print your pivot by clicking on Print Pivot grid and this will bring up a Preview box for the pivot where you can adjust as needed before printing:
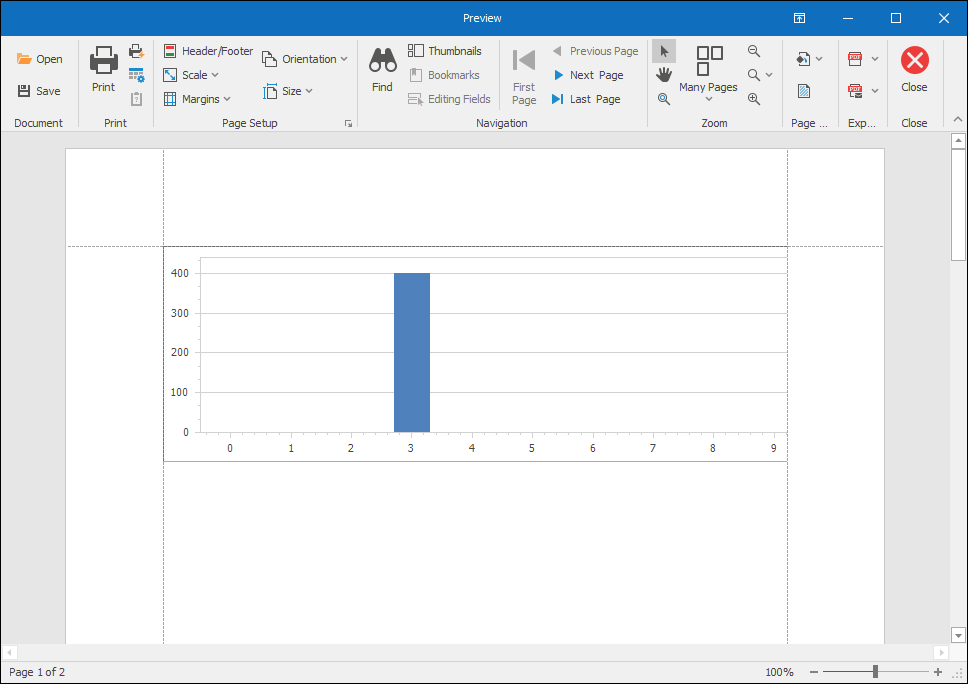
❖In the Chart tab you can print the chart by clicking Print Chart and again the Preview box will come up where you can adjust as needed before printing:
❖Right clicking in the top of the pivot area brings up a context menu where you can choose to Reload Data (if anything had been changed in your data):

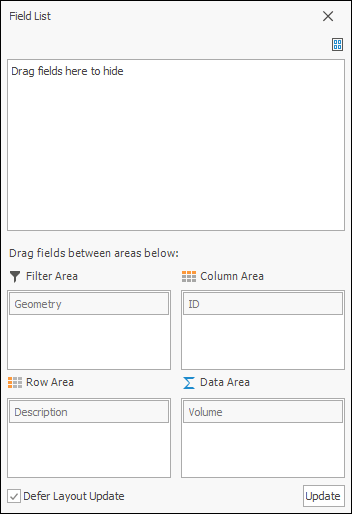
Show Field List will bring up the Field List dialogue where you can manage the fields of your pivot by choosing which fields go where and which you would like to hide:
And Show Filter Editor will bring up the Filter Editor where you can customize filters for the fields:
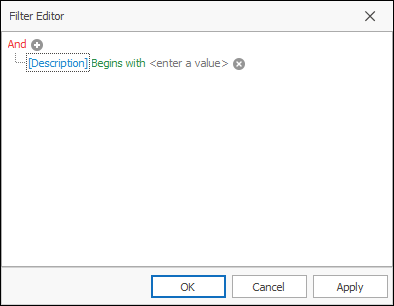
For full data on how the Filter Editor works see Layer Data Grid Guide, Column Header Area Context Menu)
❖Right clicking on one of the field headers you can Best Fit it so it is sized optimally in the pivot:


You can also Order fields if more than one is being used in the column, row or data areas:

❖By right clicking in the row and column areas you can choose to sort the rows by the columns or the columns by the rows:
