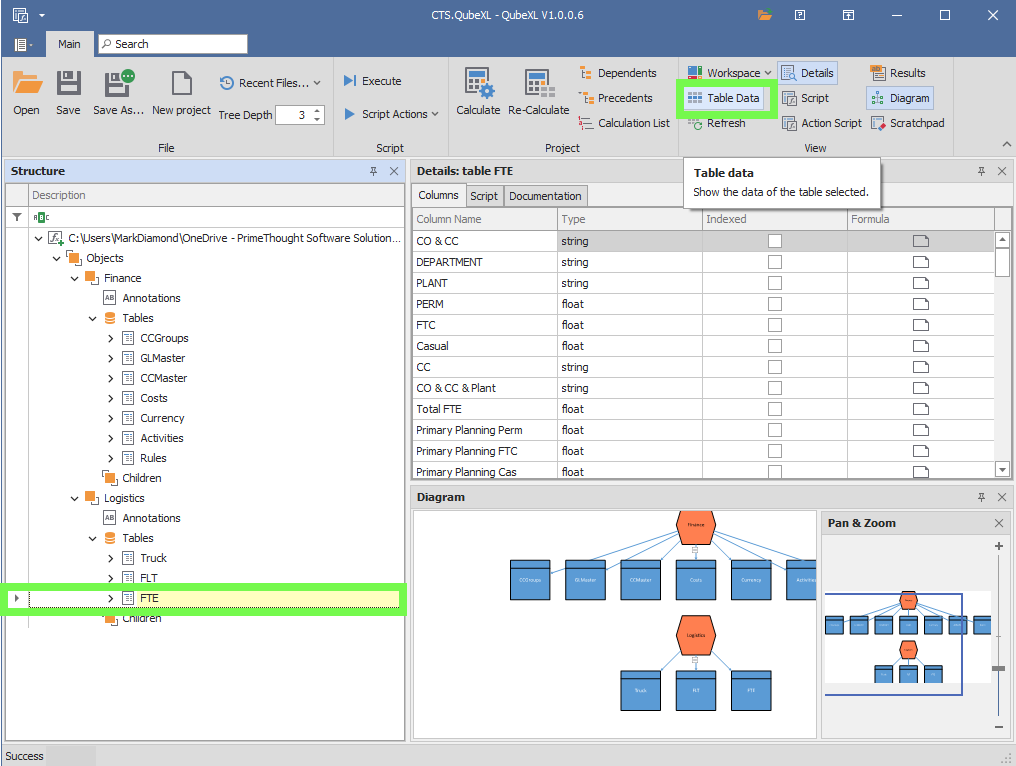
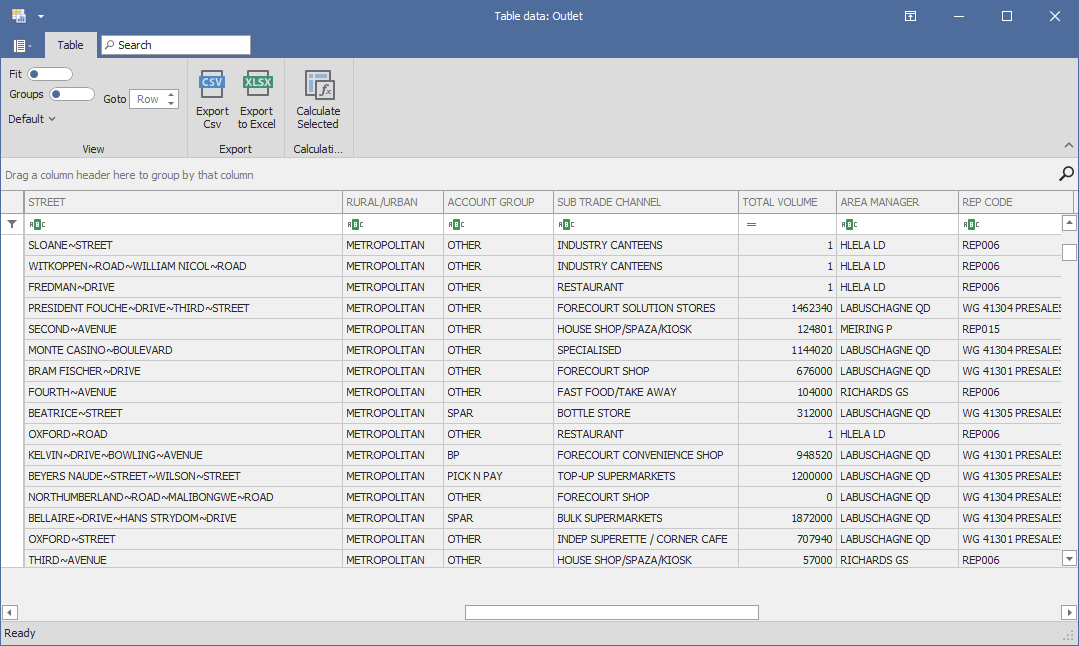
❖To view the data of a table, click on the desired table in the tree structure and then you can click the Table Data button, this will bring up a data grid where you can view, sort, filter etc. your data:
(This same data grid can be brought up by right clicking on desired table and selecting View Data)
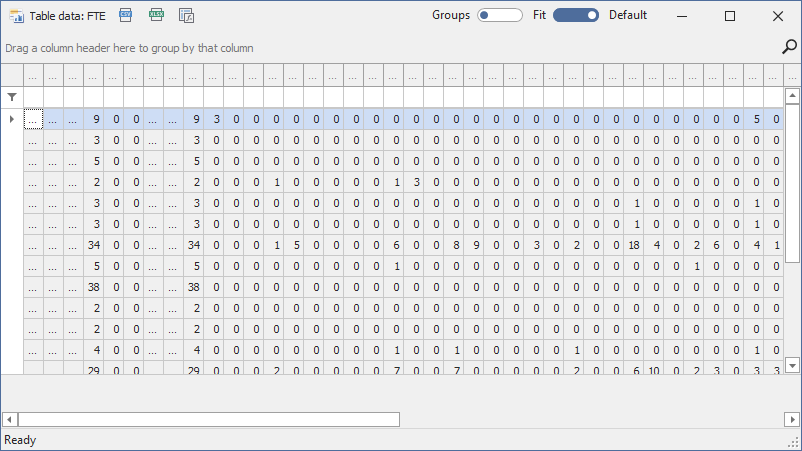
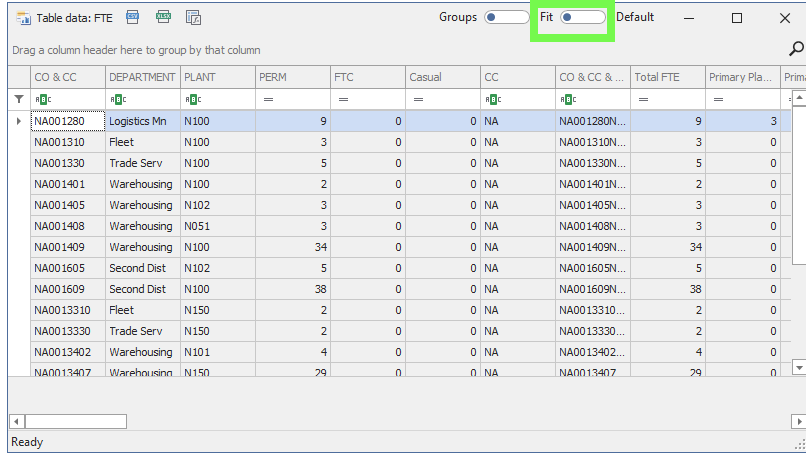
To see your columns better you can toggle off Fit, which fits all your columns into the box:
❖You can filter on columns, sort and even group by your columns by dragging the column header and dropping it in the grouping area:
Filter:
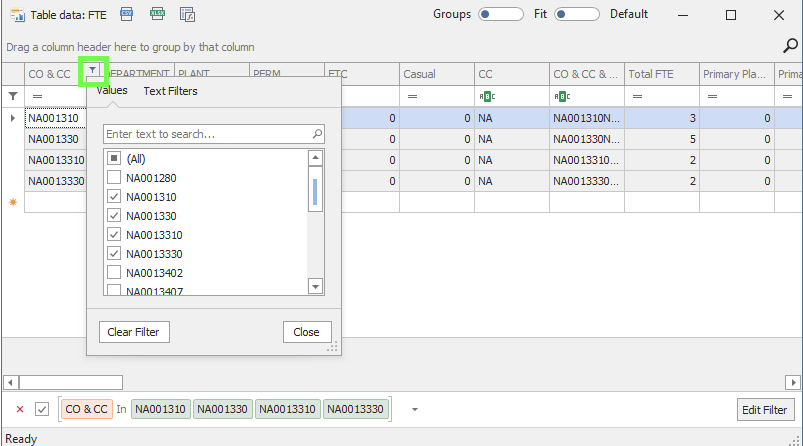
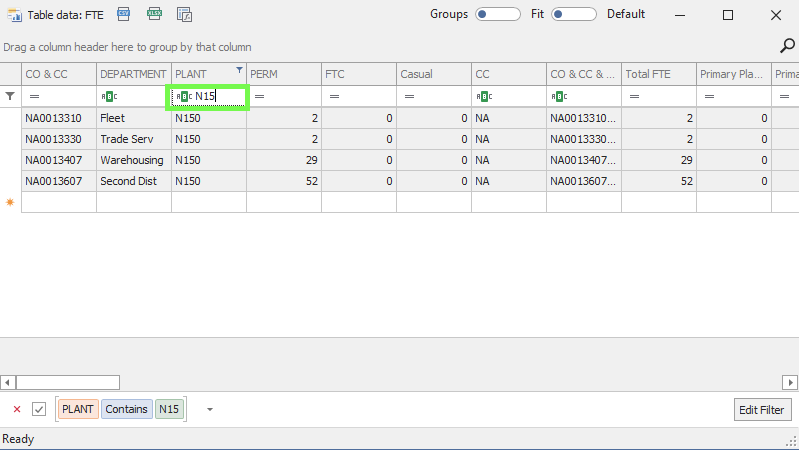
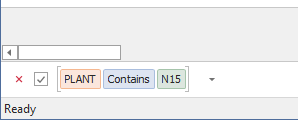
To clear a filter, you can just click the little x at the bottom left of the window, or you can even just untick the filter so that you can easily tick it back on:
Sort:
To sort ascending you can click once on the desired column header and to sort descending click twice:
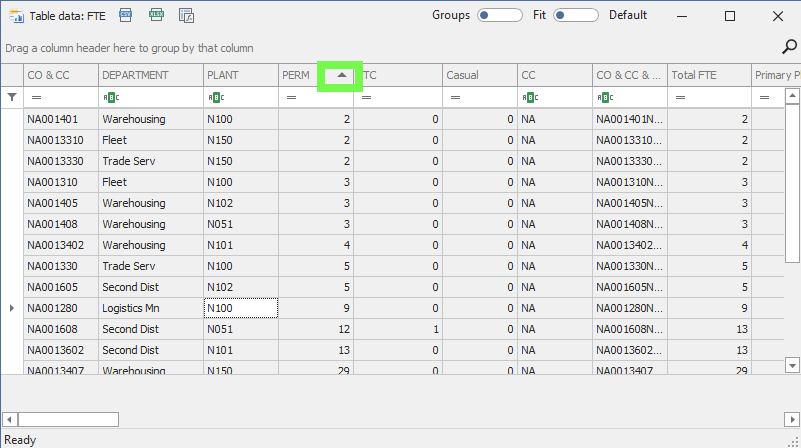
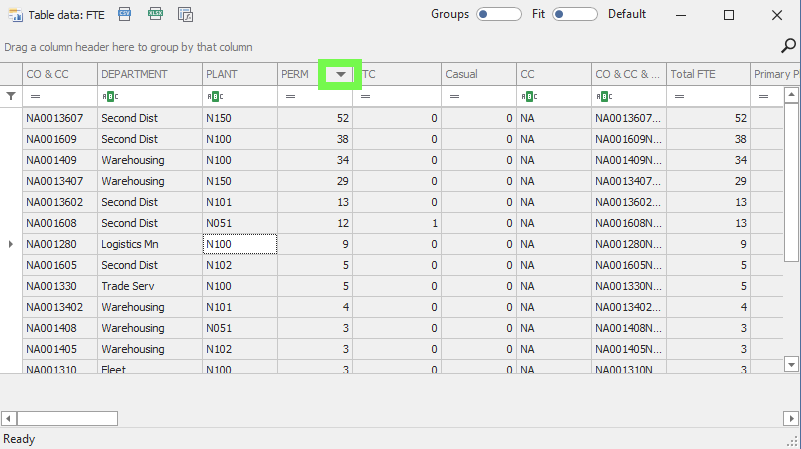
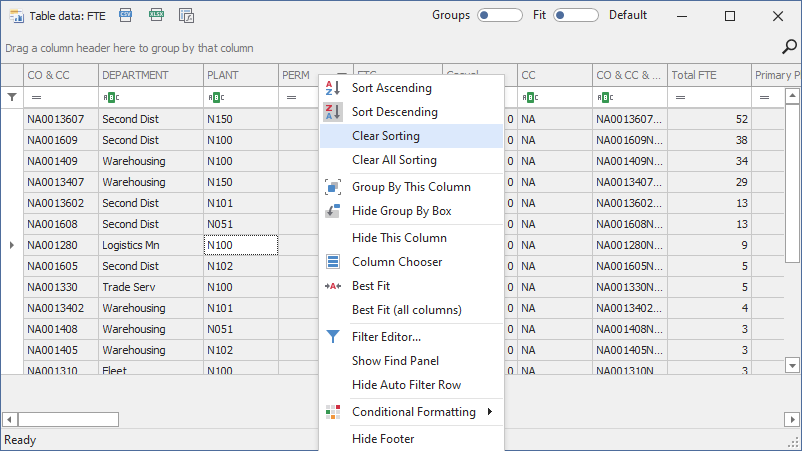
You can clear the sorting by right clicking on the column header and select Clear Sorting:
Group:
To group your data by a specific column header, click and drag the desired header into the grouping area above:
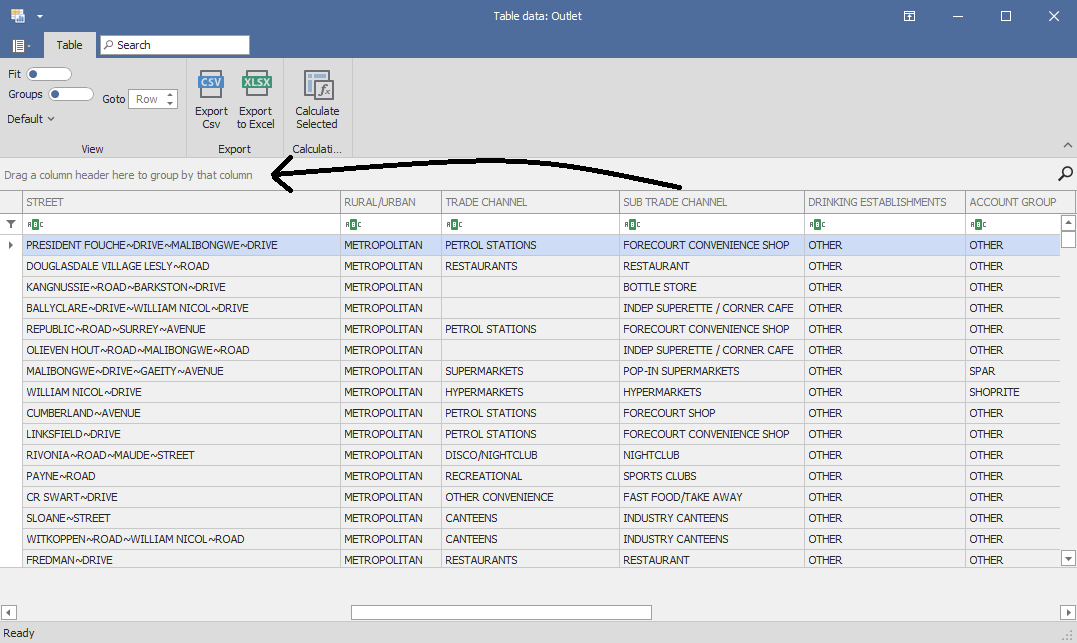
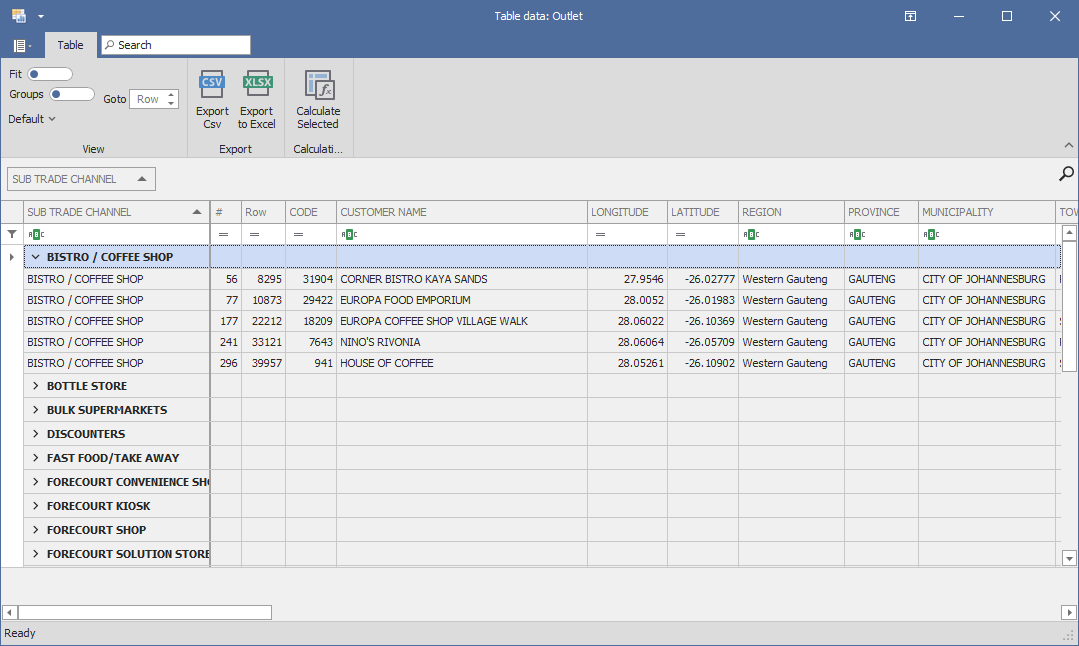
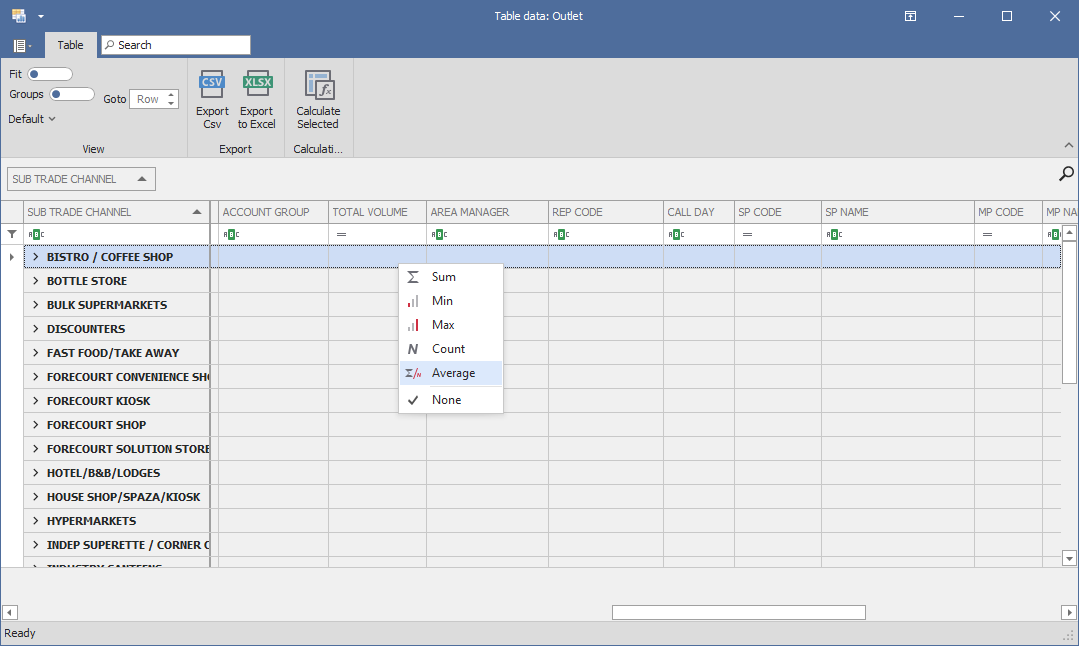
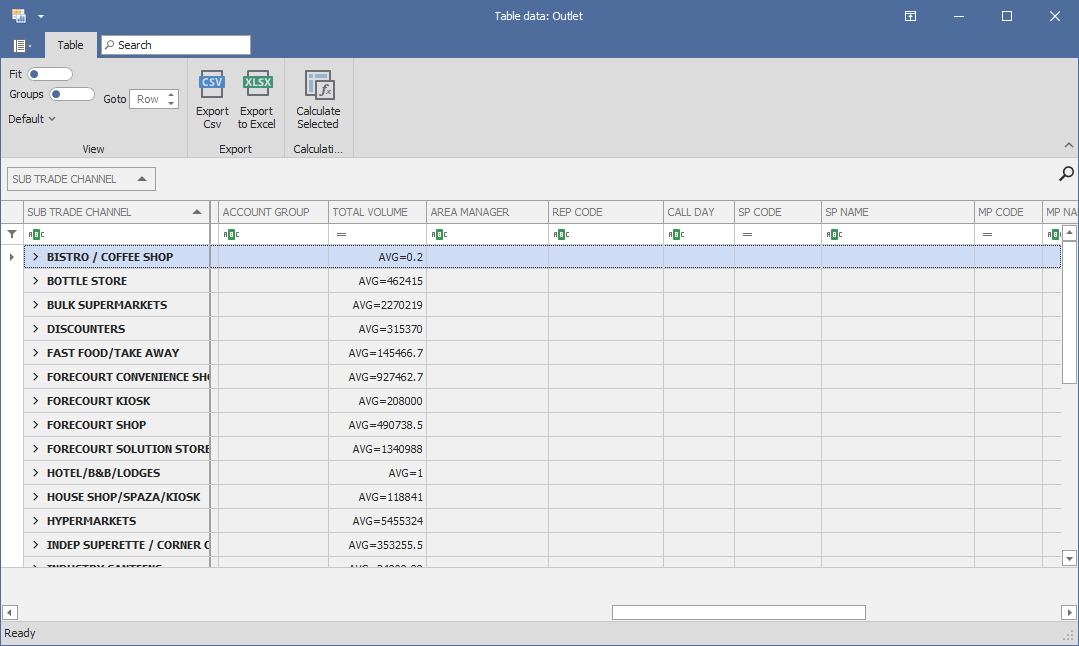
You can then get totals of a certain column, broken down for the different groupings, by right clicking on a cell beneath the column header such as the Average Total Volume:
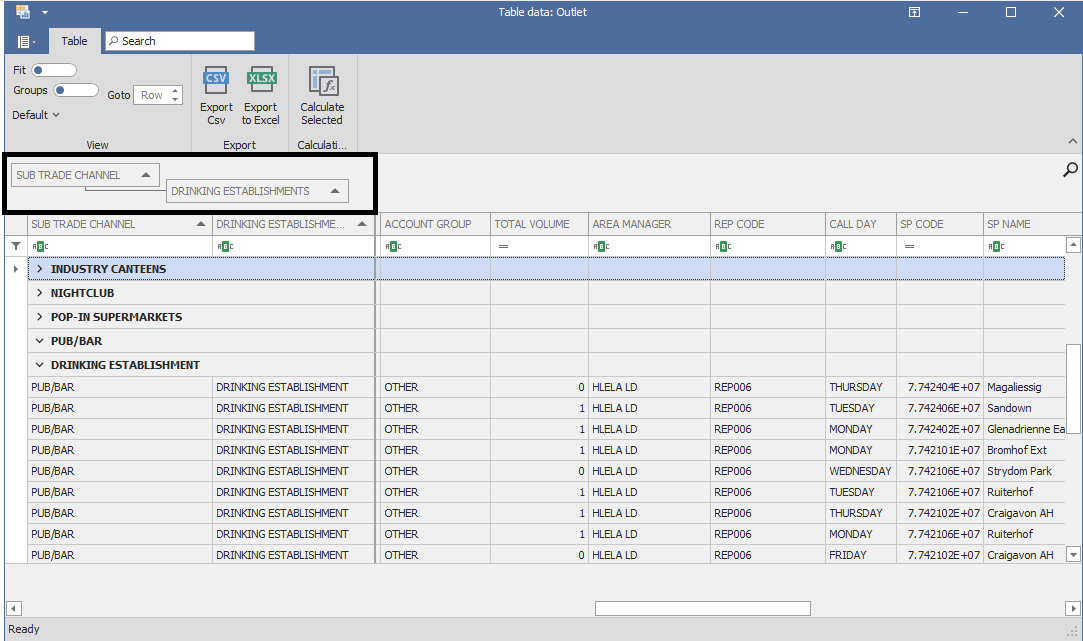
You can group on more than one column header at once, for example I will add another column to group by here, and it will just further group my data for me so that it is grouped by Sub Trade Channel and further by whether it is a Drinking Establishment or not:
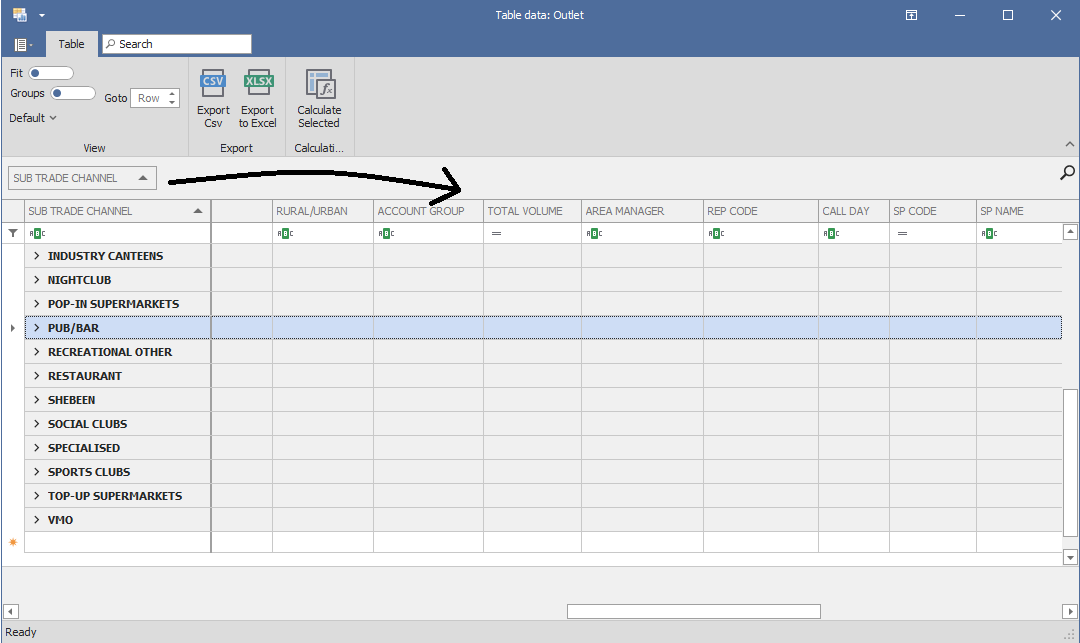
To ungroup columns simply drag the column header out of the grouping area and back into position in the grid where it was:
Fix, Move, and Hide Columns:
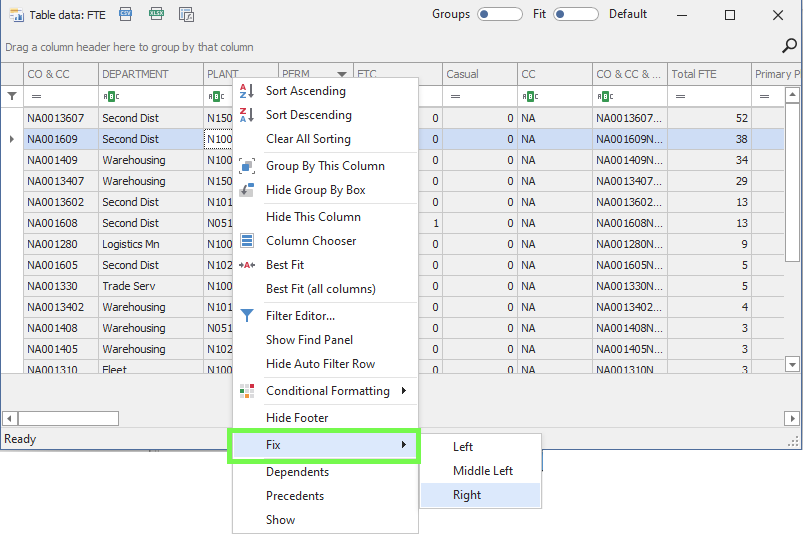
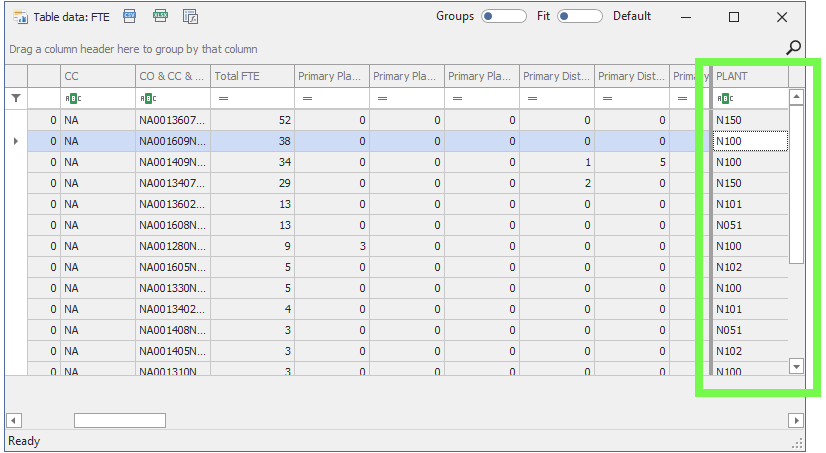
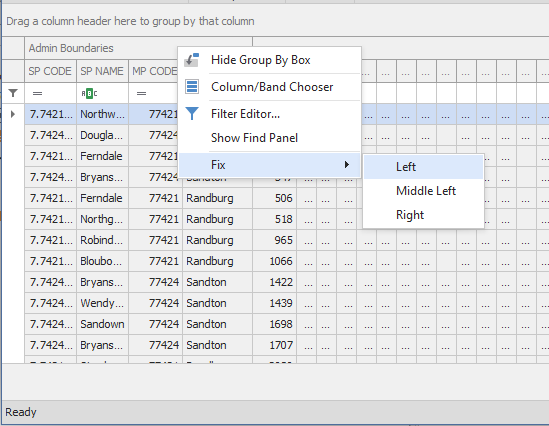
❖You can choose to freeze/fix any column you want and in which position by right clicking on the column header and then selecting Fix and then the position, and it will stay fixed in view as you browse through your other columns:
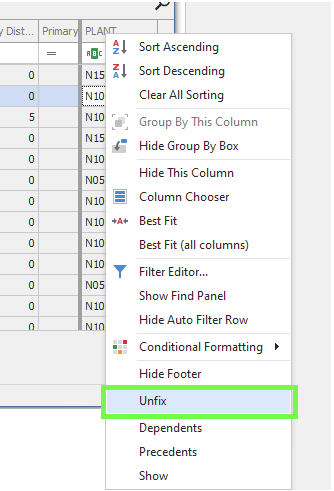
To unfix a column, just right click on the column header and select Unfix:
❖You can move columns around by clicking on the column header and dragging and then dropping them in the desired position:
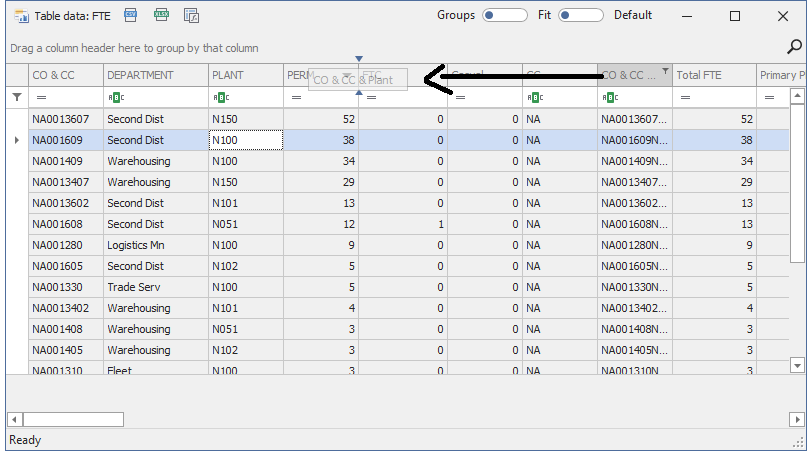
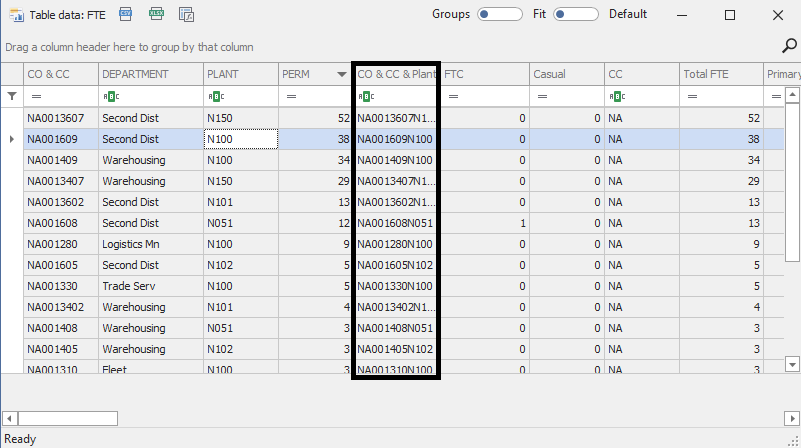
❖You can hide columns that you don’t want to see by clicking on the column header and dragging and dropping them below:
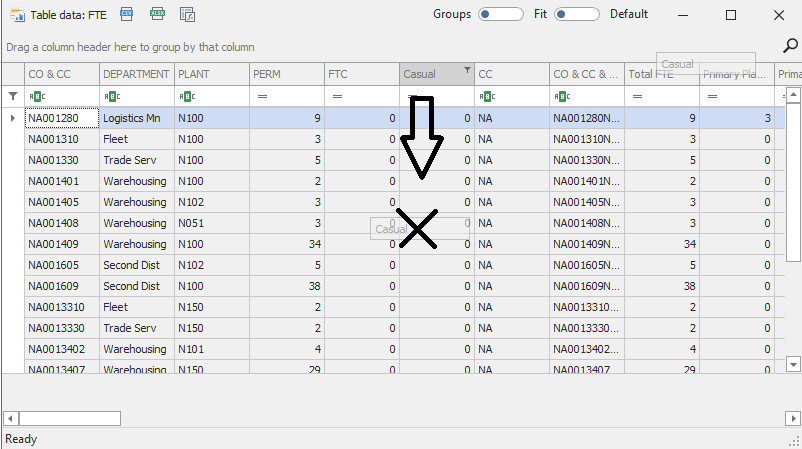
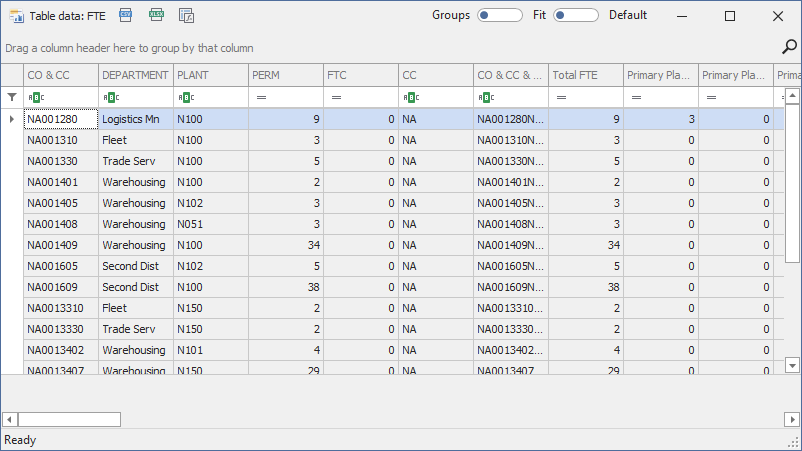
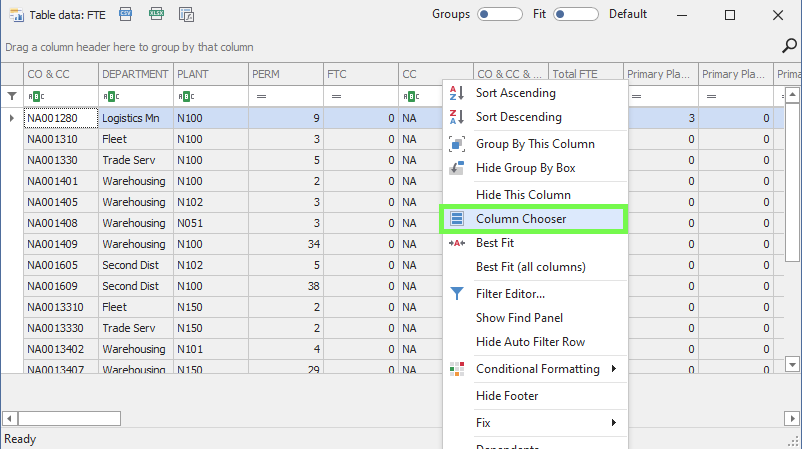
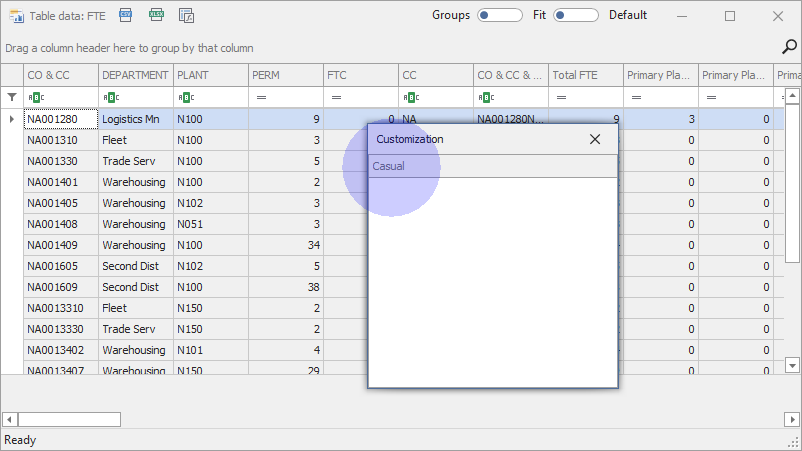
❖To see all hidden columns right click on any column header and select Column Chooser; here you can see a list of hidden columns and can double click on a column to show it again:
Groups Toggle:
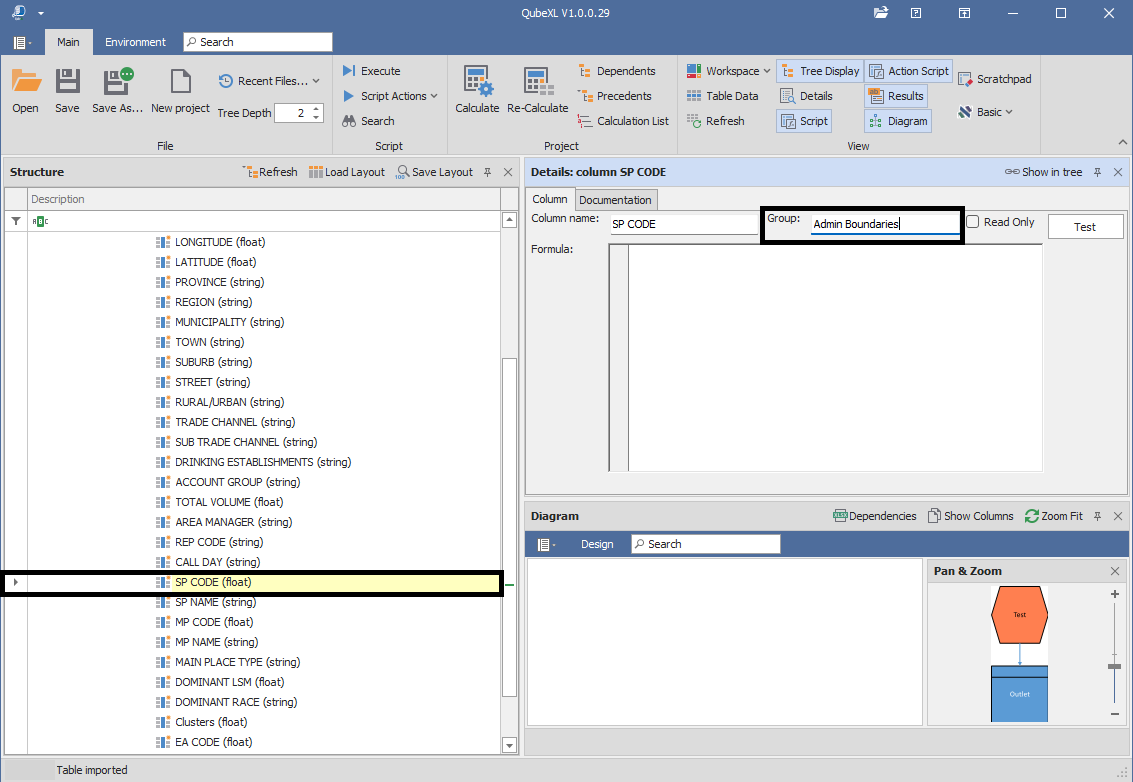
❖You can assign columns in a table to a group by specifying this in the Column Details for the column:
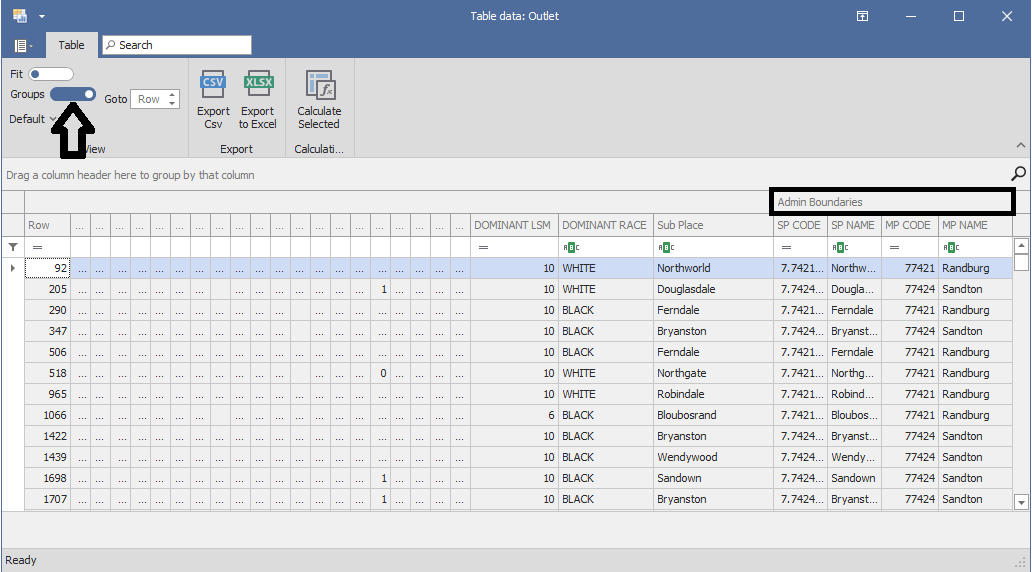
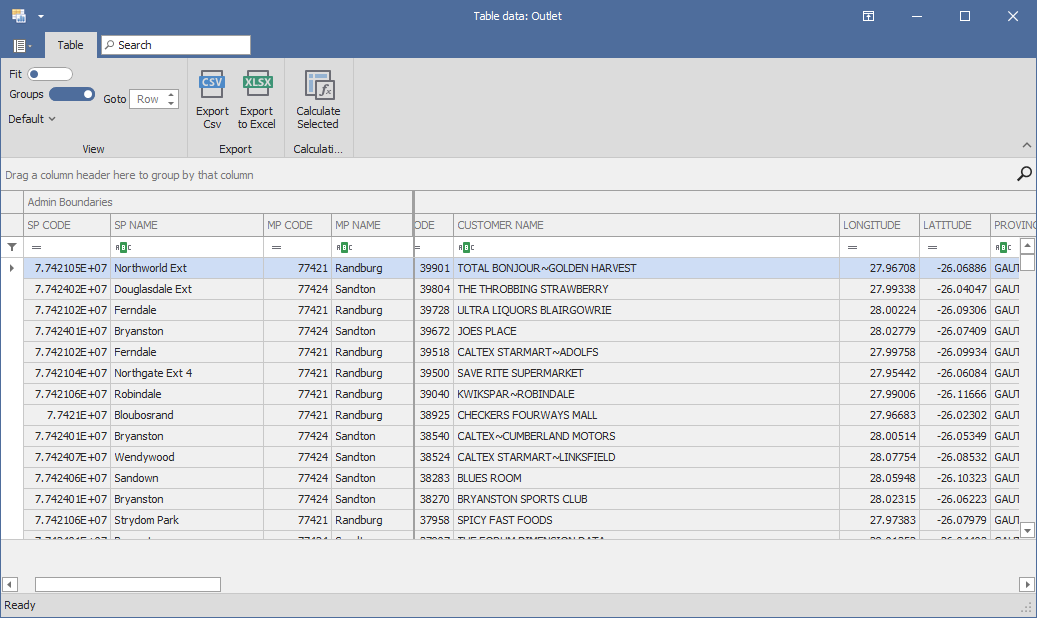
Then when you view the table data you can toggle on Groups to get a view of which columns are grouped together (assigned to the same group), in this example I have 4 columns assigned to the Admin Boundaries group:
Now what you can do is, using the Column/Band Chooser, move a whole group/band of columns by dragging the group header into the Customization box:
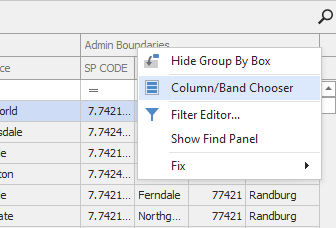
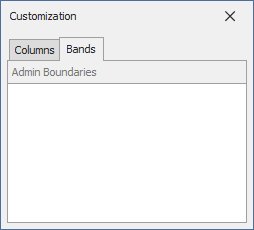
And then dragging it into the new desired position in the data grid:
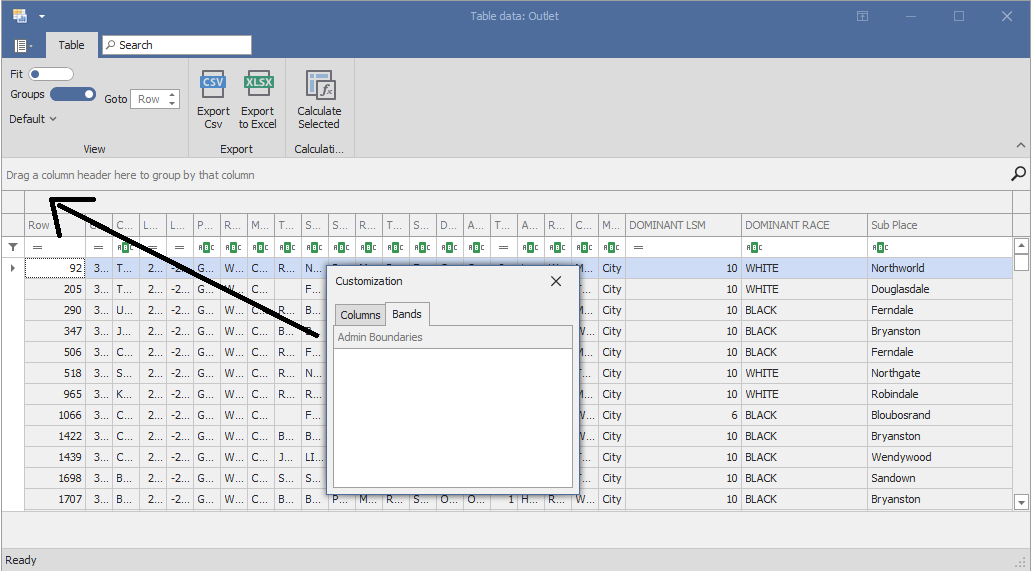
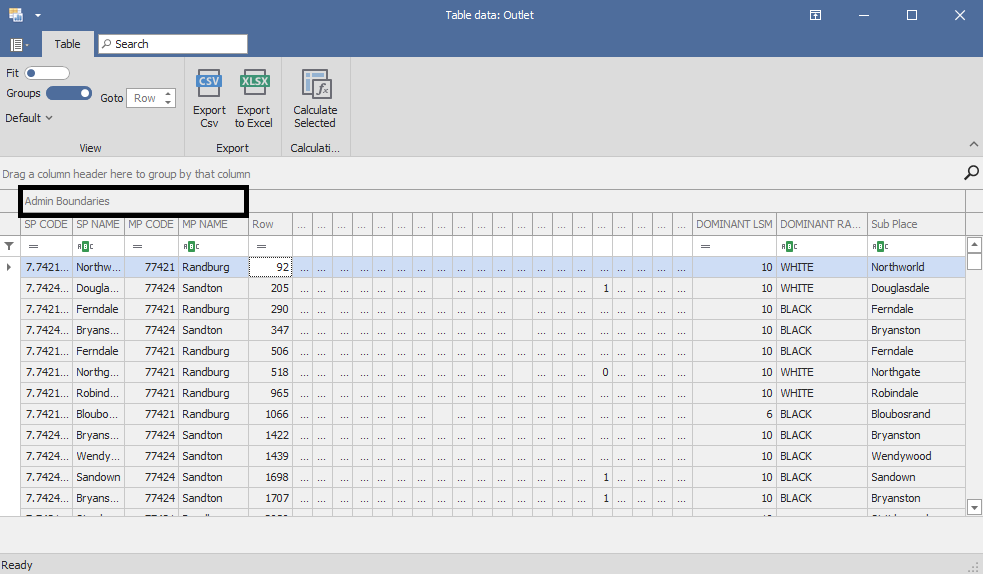
When Groups is toggled on and you are in Groups view, you can only fix groups in position and not columns:
Layouts:
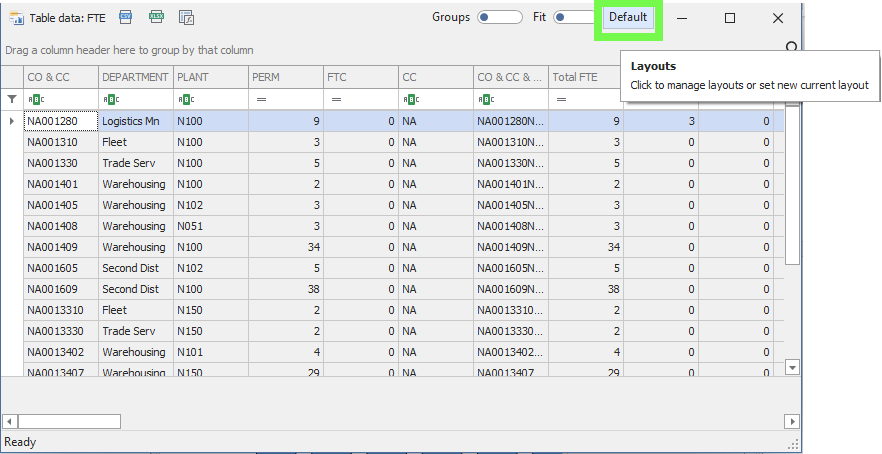
❖When you have set up your grid in a certain way this can be saved as a layout that can then be used again easily, you can create many layouts and switch between layouts. To create a layout, click on Default above (this is your default layout, any set-up you do with your grid while Default is showing will be saved as the Default layout):
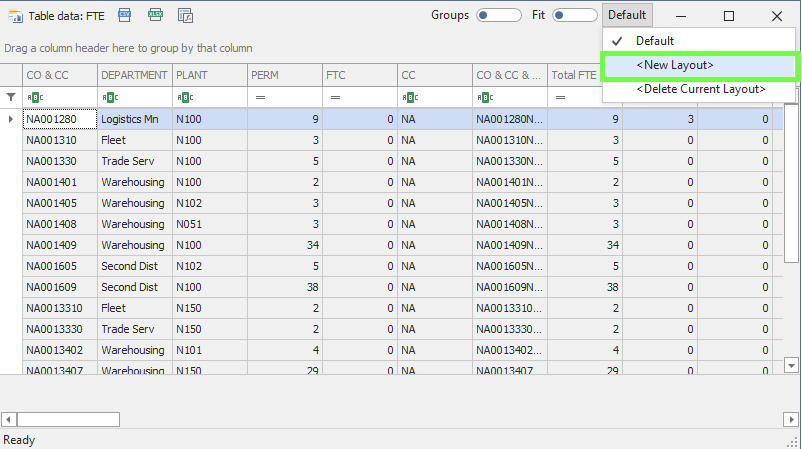
Give it a name and click OK, this will then be the active layout and anything you set up in the grid will be saved in this layout:

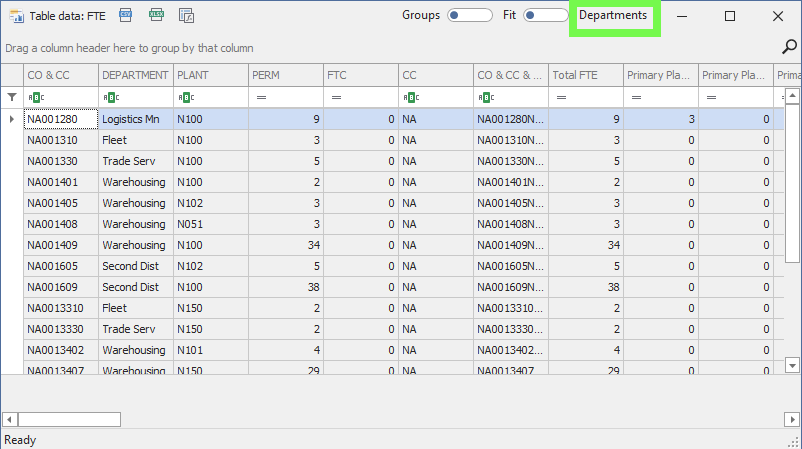
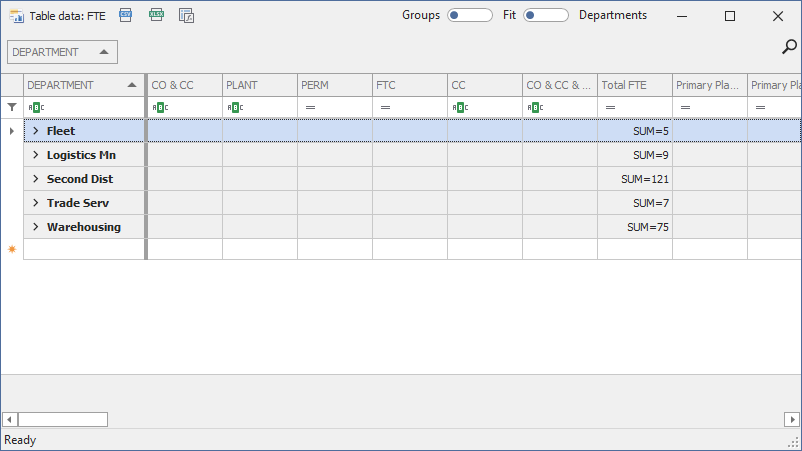
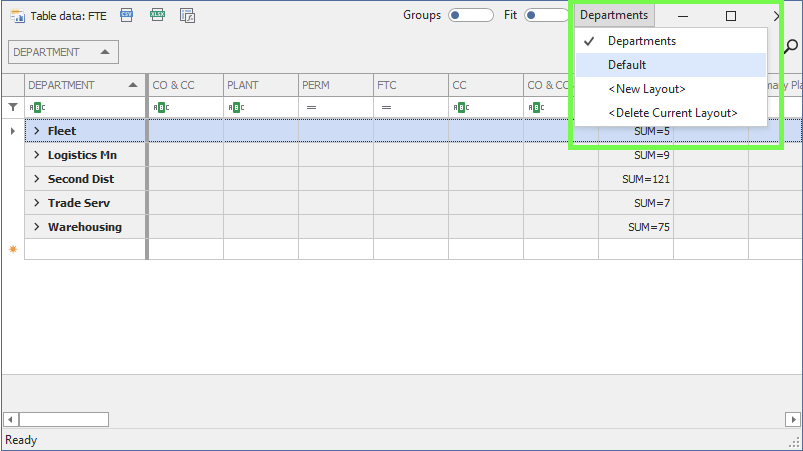
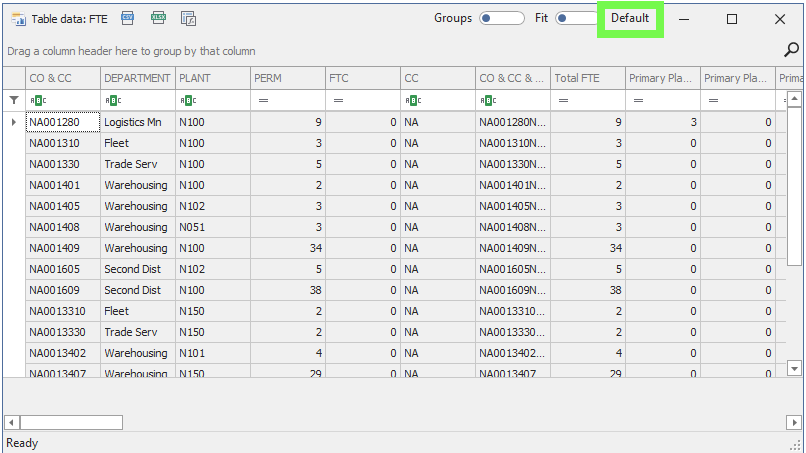
Then by clicking on the layout name to dropdown your list of layouts, you can switch to another layout or back to the Default one by clicking on it:
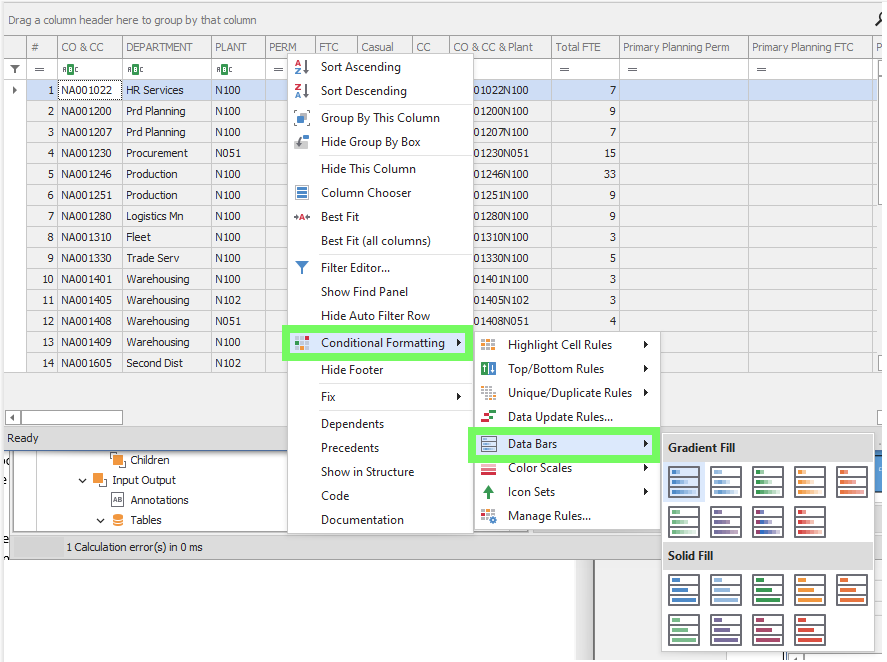
You can also add formatting to your table columns such as putting data bars; to do this right click on the column header:
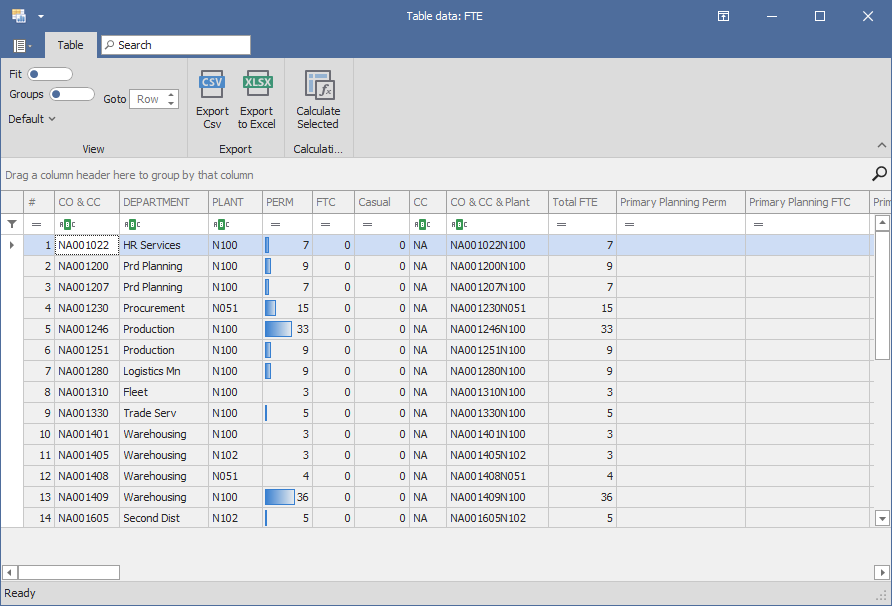
These layouts are saved in your data table and you can exit the table and bring it up again and your set-up will be remembered.
Editing Data:
In order to edit data in a column, it must not be set as Read Only in its Details, if it is you won’t be able to edit it:
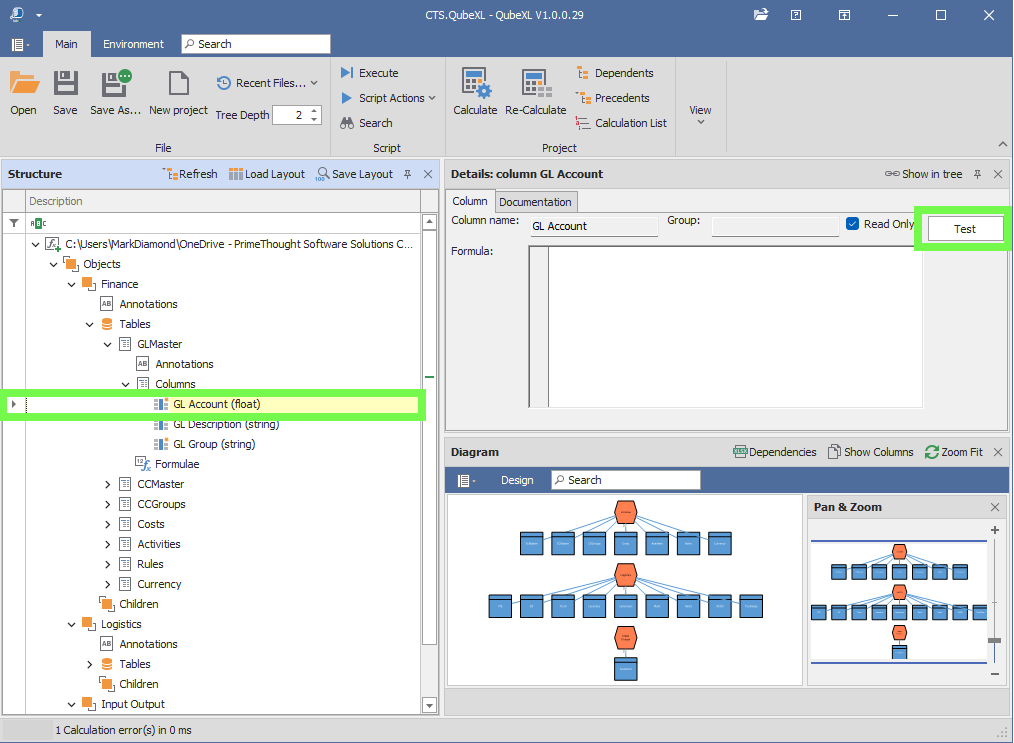
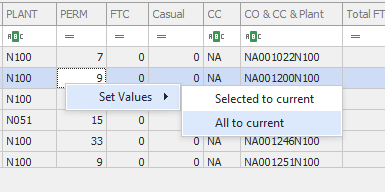
Data can be edited in the data grid by clicking on a cell and typing in. You can also right click and choose to Set Values for a column or cell:
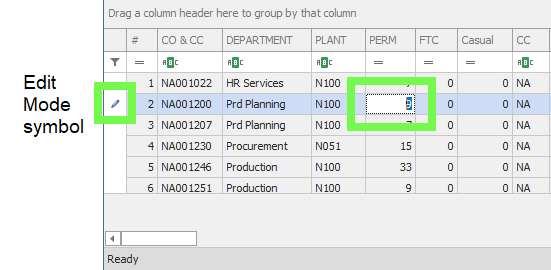
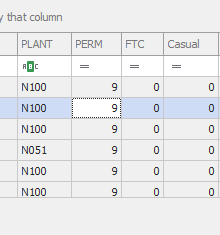
If I want to set all values to 9 in the column I will right click and select Set Values>All to current:
Editing in QubeXL is safe, because unlike Excel you can’t accidentally wipe out a formula by typing in a cell, you can only wipe out a number in QubeXL and these numbers can be reimported from their external source.
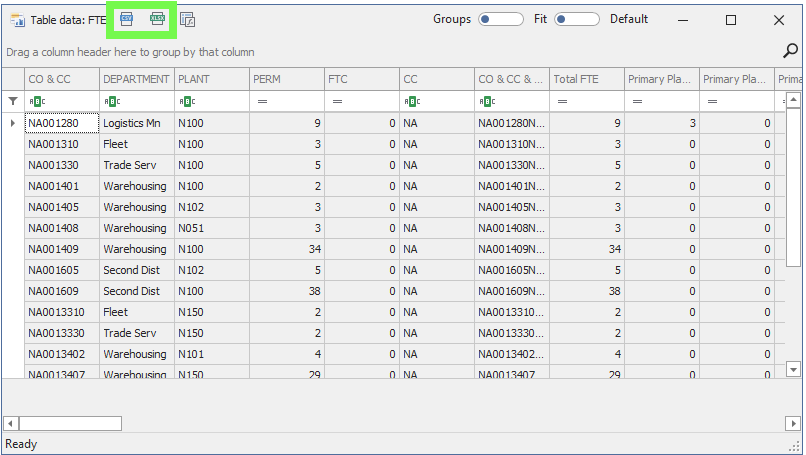
❖Your data table can be exported to CSV or Excel by clicking on the appropriate buttons above:
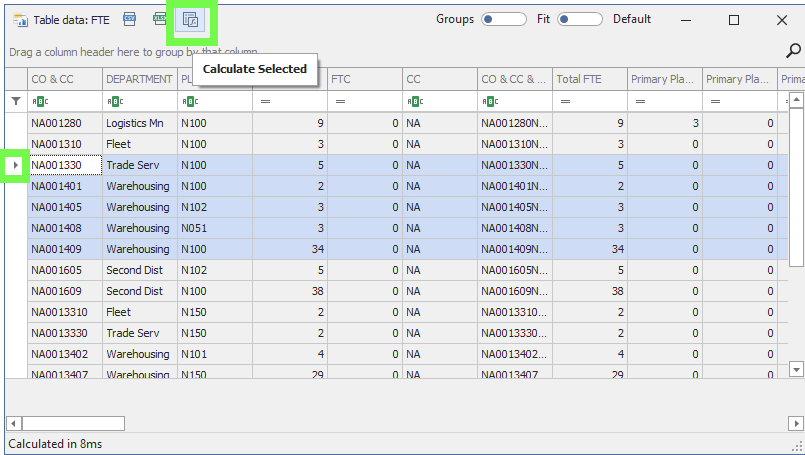
❖You can choose to calculate selected rows of data in your table only, by selecting them first, by clicking and dragging the little arrow in the left margin and then clicking the Calculate Selected button:
