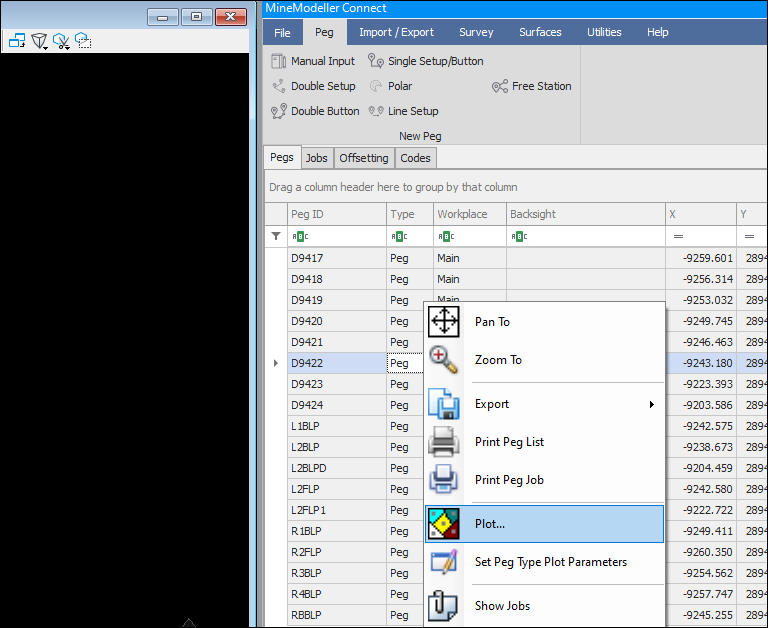
When plotting a peg or a selection of pegs, you can right click and choose the option to plot these pegs.
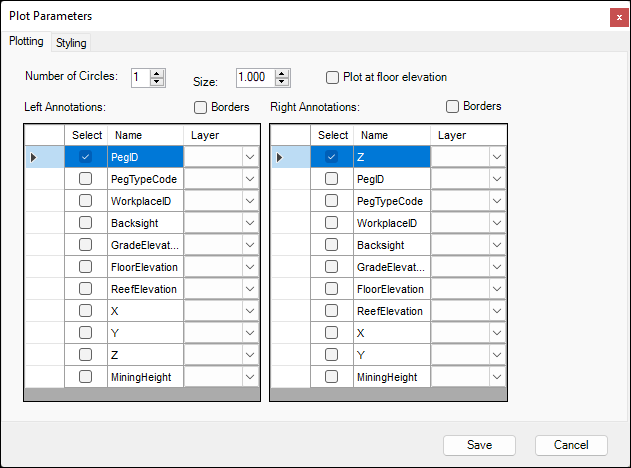
When you first plot, the program will prompt you to set the Peg Plot Parameters such as what annotations you want etc.:
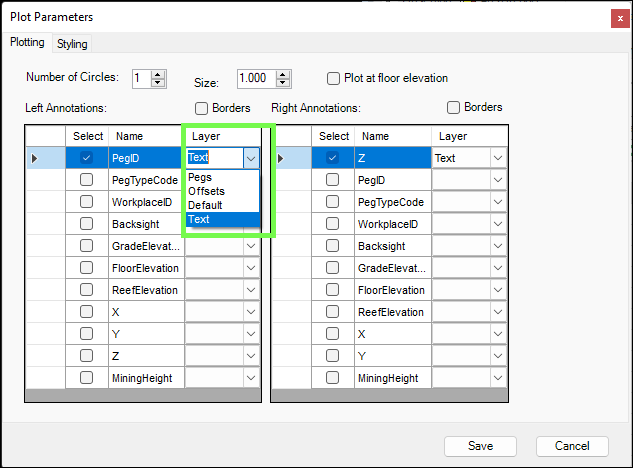
You can choose to have the annotations plotted to their own level if you want as well by dropping down under the Layer column and choosing an existing level or typing in the name of a new level that will be created for you:
In the Styling tab you can see I have chosen another level for the geometries of the pegs to be plotted to:
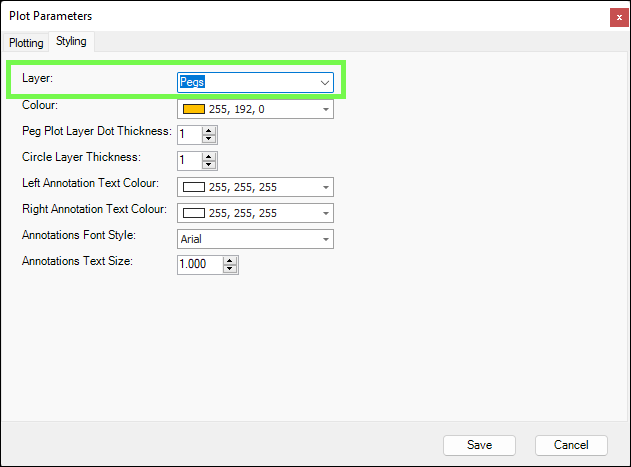
You can then set the color etc. of the plotted peg as well as the annotation text, here in the Styling tab.
These are the settings we put, and this is what the peg looks like plotted:
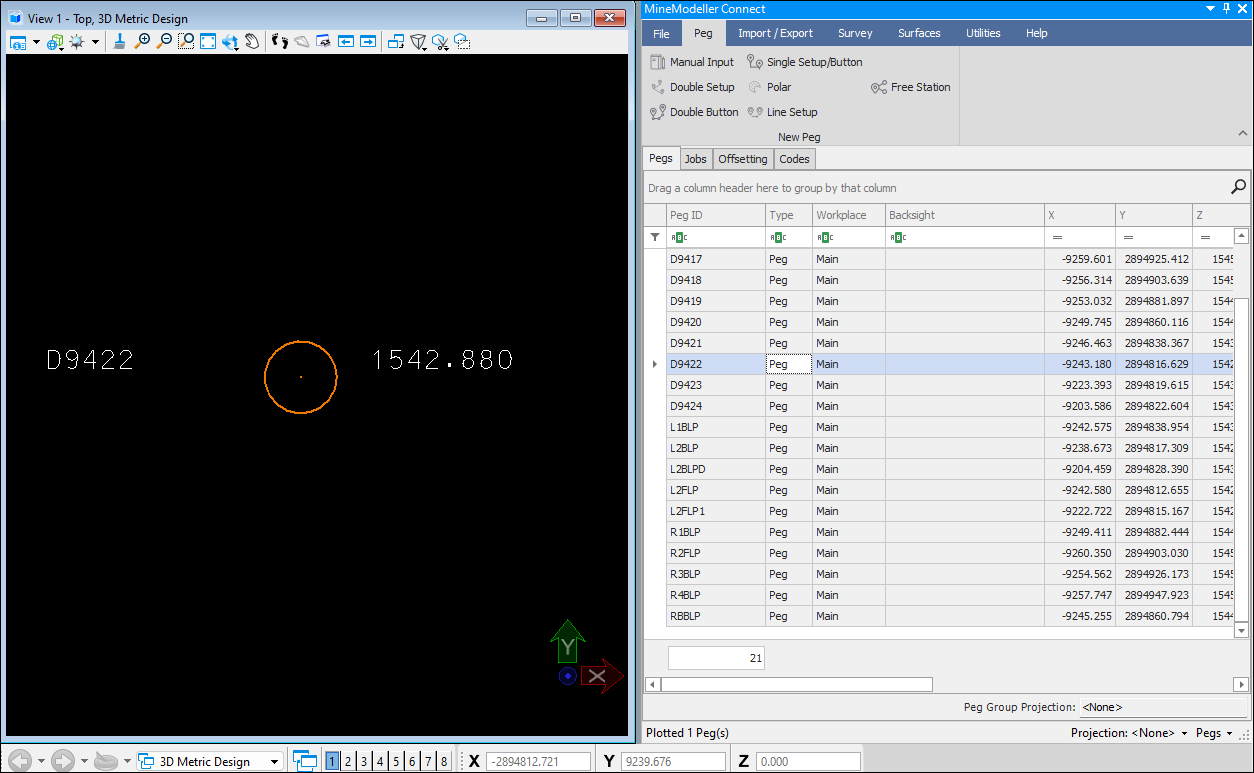
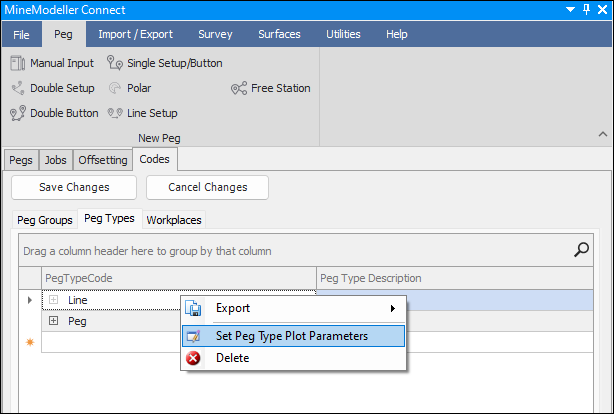
These peg plot settings are stored per peg type and can also be set up in the Codes tab by Peg Types for each type. Peg Types are covered in the Peg Types section:
